

Question: Use Summary 5b, Table 1, Column 2 1.Select one of your quantitative variables. Make a confidence interval for your selected variable. Be sure you show
Use Summary 5b, Table 1, Column 2
1.Select one of your quantitative variables.
Make a confidence interval for your selected variable. Be sure you show all the steps you took. Include a screen shot of any applet you used in your calculations.
2.Choose a confidence level (1 - ?).
3.What is xbar?
4.What is s?
5.What is t? (Show a screen shot of how you derived your t value)
6.What is k?
7.Compute your confidence interval.
8.Explain your results in everyday language.
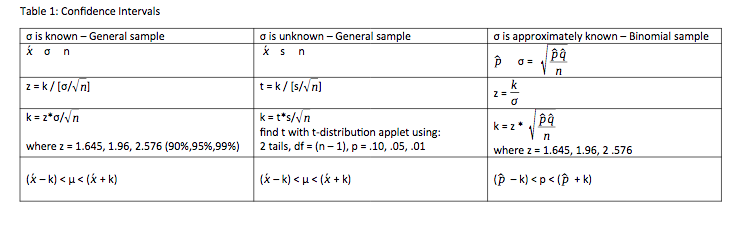
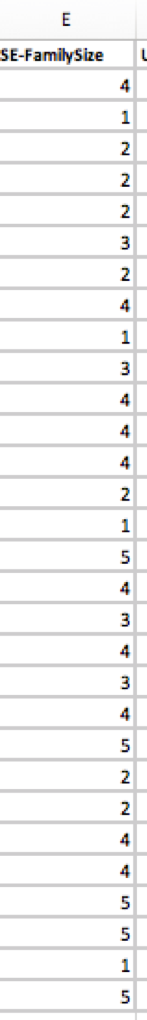
Table 1: Confidence Intervals o is known - General sample is unknown - General sample o is approximately known - Binomial sample xon ksn DO= pa z = k / [o/vm] t = k / [s/vn] k= z*o/vn k= t*s/vn pq find t with t-distribution applet using: k=z* where z = 1.645, 1.96, 2.576 (90%,95%,99%) 2 tails, df = (n - 1), p = .10, .05, .01 n where z = 1.645, 1.96, 2 .576 ( X - k]
Step by Step Solution
There are 3 Steps involved in it

Get step-by-step solutions from verified subject matter experts