

Question: Use the accompanying ProfiL Analysis spreadsheet model to answer the following questions. For part b, use the original quantity shown in the spreadsheet, not the
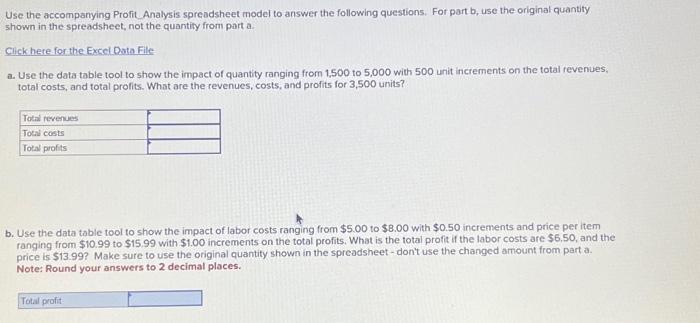
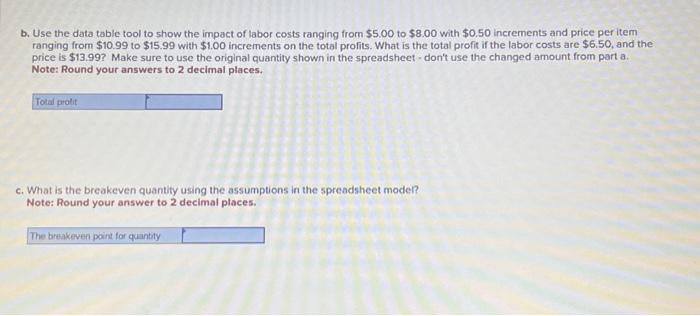
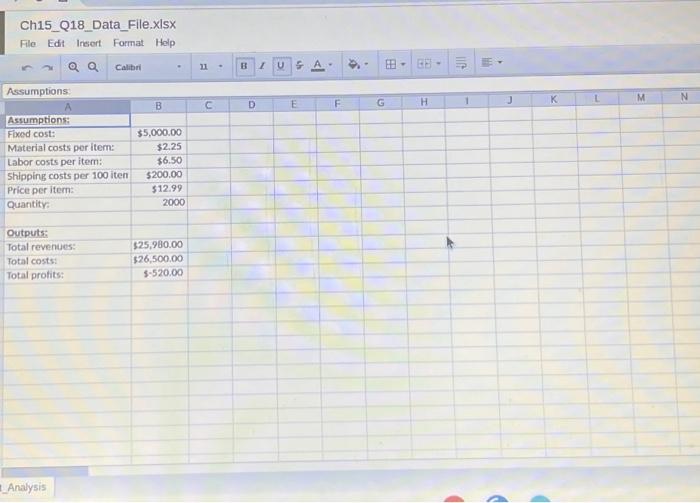
Use the accompanying ProfiL Analysis spreadsheet model to answer the following questions. For part b, use the original quantity shown in the spreadsheet, not the quantity from part a. Click here for the Excel Data File a. Use the data table tool to show the impact of quantity ranging from 1,500 to 5,000 with 500 unit increments on the total revenues. total costs, and total profits. What are the revenues, costs, and profits for 3,500 units? b. Use the data table tool to show the impact of labor costs ranging from $5.00 to $8.00 with $0.50 increments and price per item ranging from $10.99 to $15.99 with $1.00 increments on the total profits. What is the total profit if the labor costs are $6.50, and the price is $13.99 ? Make sure to use the original quantity shown in the spreadsheet-don't use the changed amount from part a. Note: Round your answers to 2 decimal places. b. Use the data table tool to show the impact of labor costs ranging from $5.00 to $8.00 with $0.50 increments and price per item ranging from $10.99 to $15.99 with $1.00 increments on the total profits. What is the total profit if the labor costs are $6.50, and the price is $13.99 ? Make sure to use the original quantity shown in the spreadsheet - don't use the changed amount from part a. Note: Round your answers to 2 decimal places. c. What is the breakeven quantity using the assumptions in the spreadsheet model? Note: Round your answer to 2 decimal places. Ch15_Q18_Data_File.xisx File Edit Insert Format Help Assumptions: Analysis Use the accompanying ProfiL Analysis spreadsheet model to answer the following questions. For part b, use the original quantity shown in the spreadsheet, not the quantity from part a. Click here for the Excel Data File a. Use the data table tool to show the impact of quantity ranging from 1,500 to 5,000 with 500 unit increments on the total revenues. total costs, and total profits. What are the revenues, costs, and profits for 3,500 units? b. Use the data table tool to show the impact of labor costs ranging from $5.00 to $8.00 with $0.50 increments and price per item ranging from $10.99 to $15.99 with $1.00 increments on the total profits. What is the total profit if the labor costs are $6.50, and the price is $13.99 ? Make sure to use the original quantity shown in the spreadsheet-don't use the changed amount from part a. Note: Round your answers to 2 decimal places. b. Use the data table tool to show the impact of labor costs ranging from $5.00 to $8.00 with $0.50 increments and price per item ranging from $10.99 to $15.99 with $1.00 increments on the total profits. What is the total profit if the labor costs are $6.50, and the price is $13.99 ? Make sure to use the original quantity shown in the spreadsheet - don't use the changed amount from part a. Note: Round your answers to 2 decimal places. c. What is the breakeven quantity using the assumptions in the spreadsheet model? Note: Round your answer to 2 decimal places. Ch15_Q18_Data_File.xisx File Edit Insert Format Help Assumptions: Analysis
Step by Step Solution
There are 3 Steps involved in it

Get step-by-step solutions from verified subject matter experts