

Question: Use the box and whisker plot to answer the following question. What is the interquartile range of the data set? Search unt X E Edulas
Use the box and whisker plot to answer the following question.
What is the interquartile range of the data set?
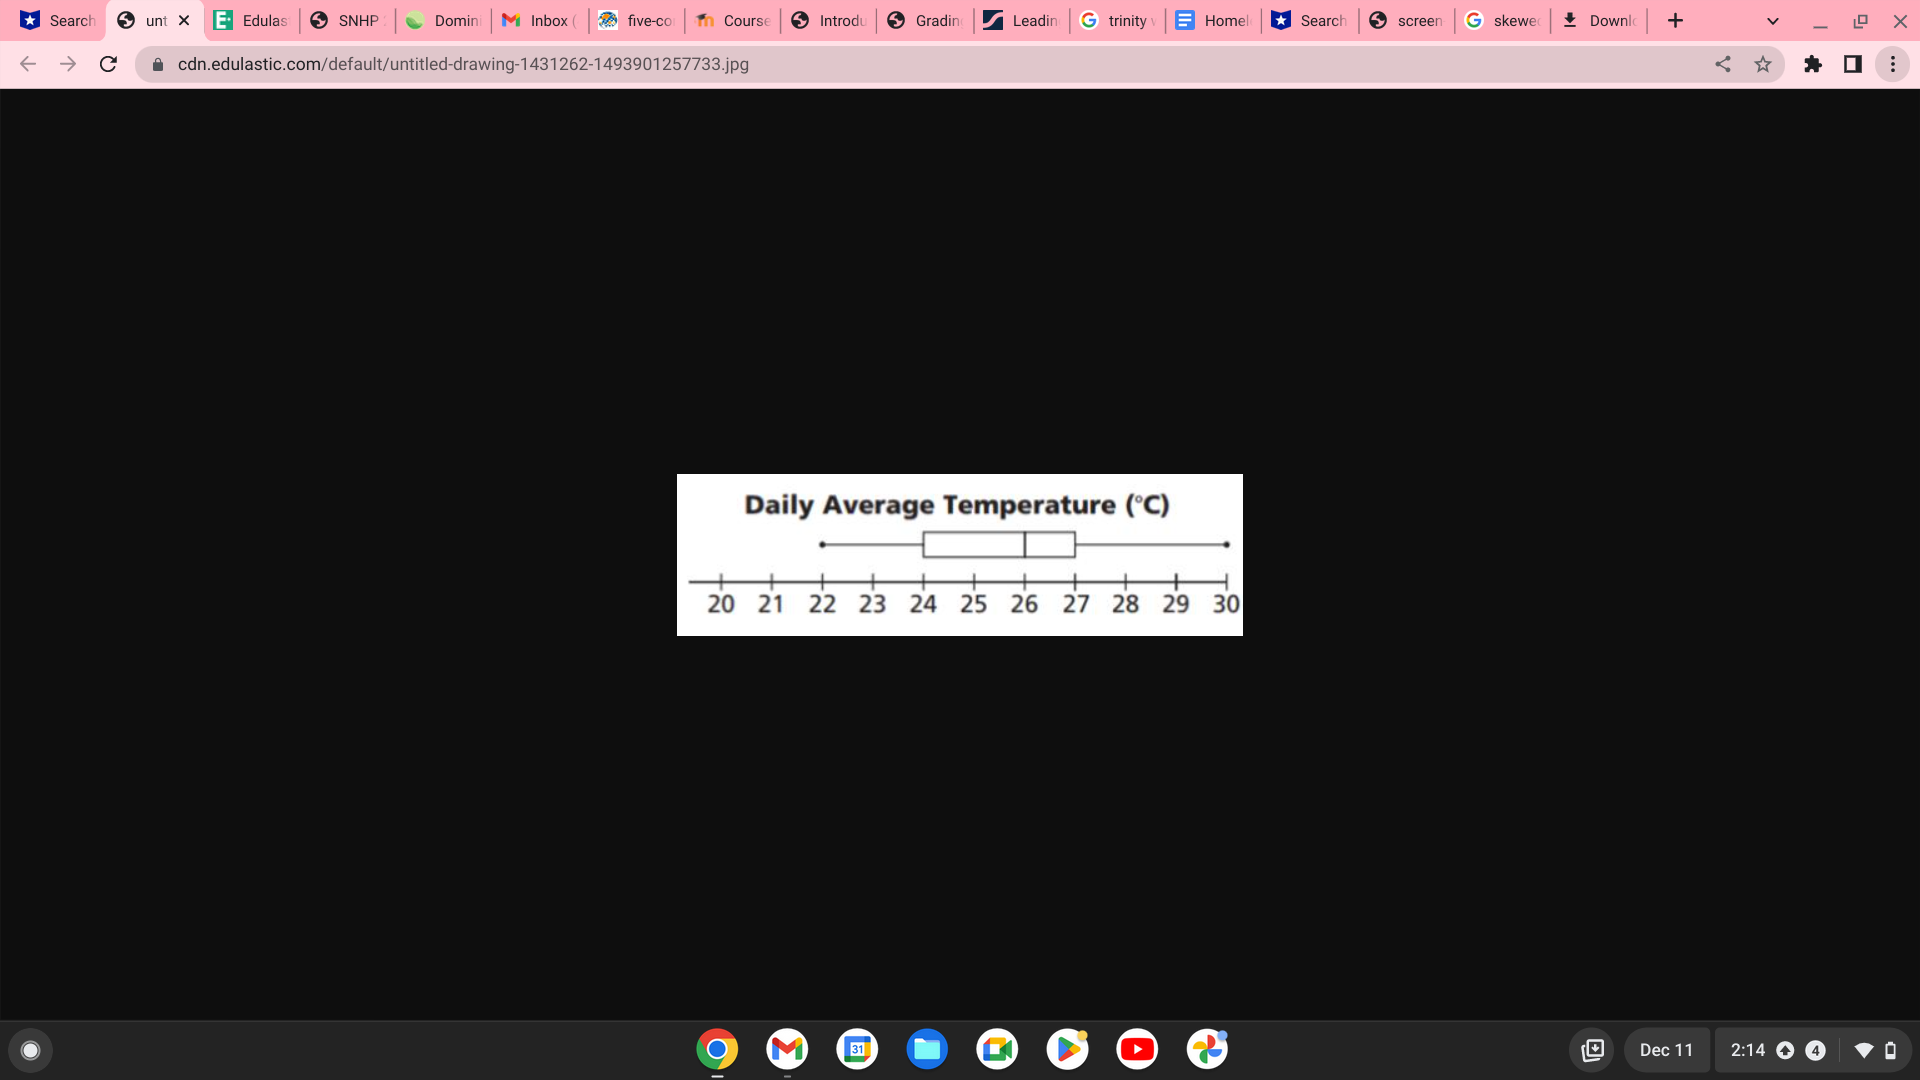
Search unt X E Edulas SNHP Domini i M Inbox five-co in Course Introdu Grading Leadin G trinity E Homel Search screen G skewec Downic + X - C cdn.edulastic.com/default/untitled-drawing-1431262-1493901257733.jpg Daily Average Temperature (C) 20 21 22 23 24 25 26 27 28 29 30 M 31 O Dec 11 2:14 4
Step by Step Solution
There are 3 Steps involved in it
1 Expert Approved Answer
Step: 1 Unlock

Question Has Been Solved by an Expert!
Get step-by-step solutions from verified subject matter experts
Step: 2 Unlock
Step: 3 Unlock