

Question: Use the CapExp spreadsheet to input formulas to compute the annual free cash flows so that you can find the NPVs using a 10.1% WACC.
Use the CapExp spreadsheet to input formulas to compute the annual free cash flows so that you can find the NPVs using a 10.1% WACC. Compare the NPV's by finding the difference in NPV values to determine which is the better deal for the company.
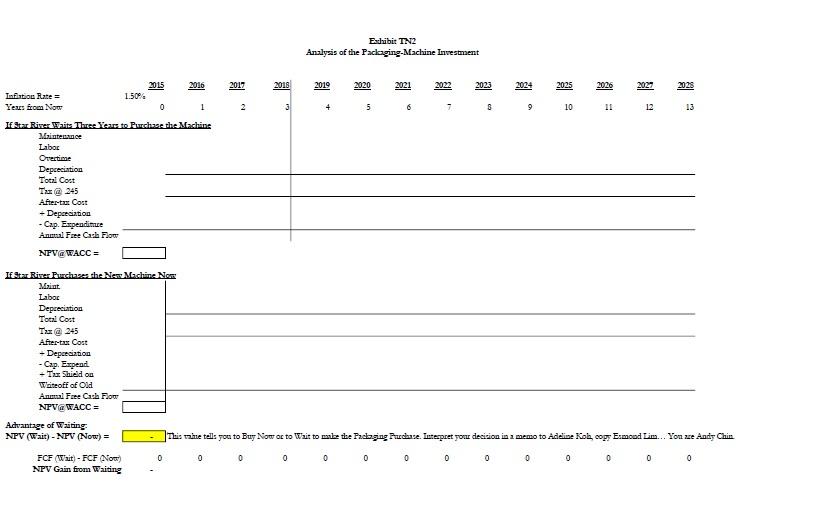
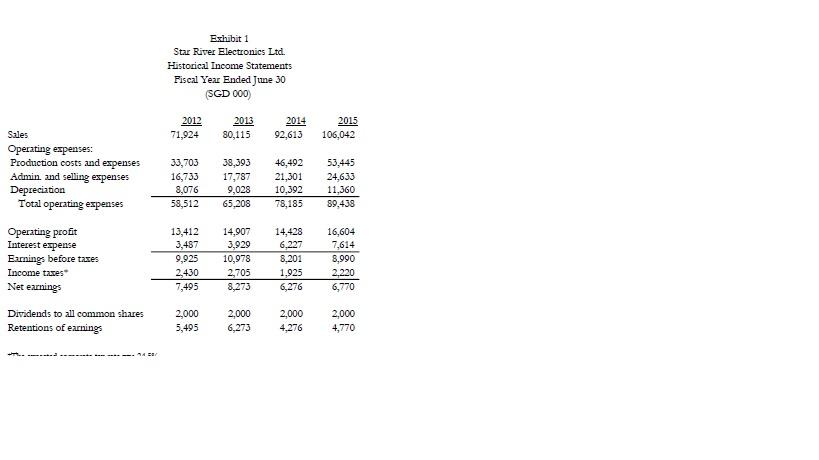
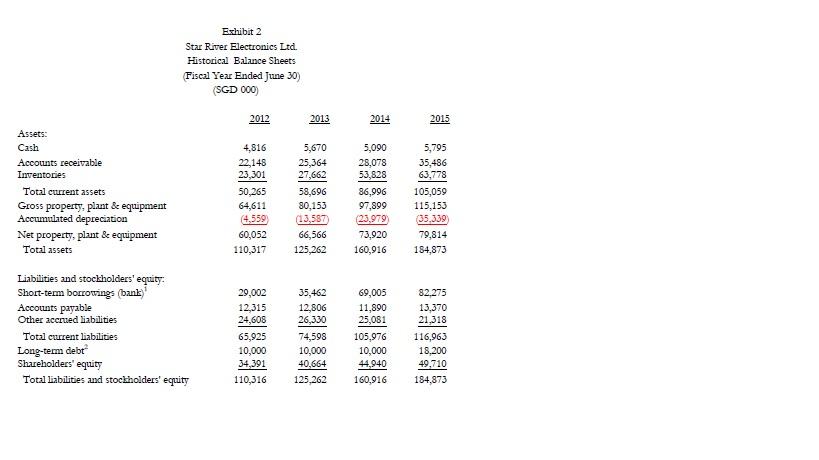
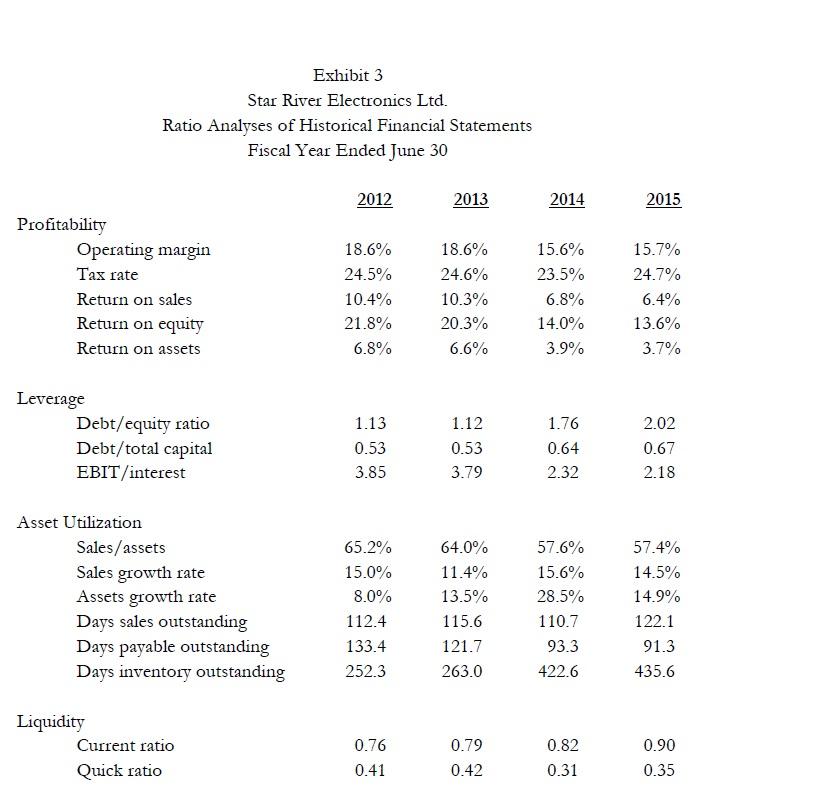
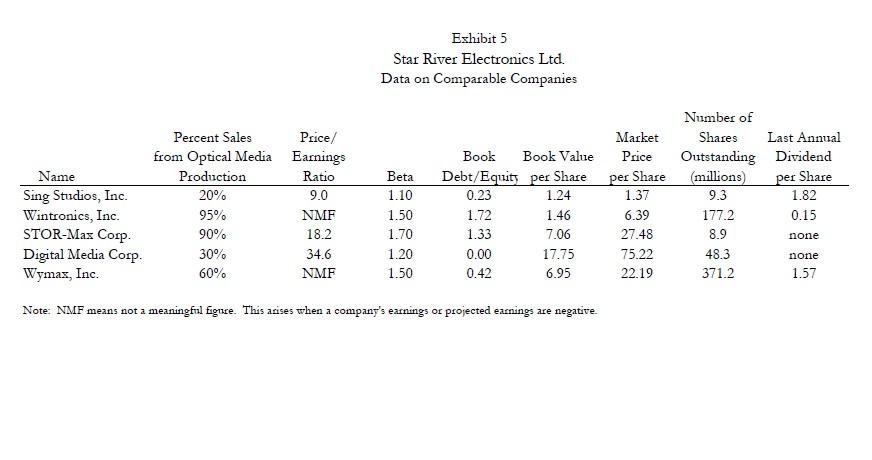
Exhibit TN2 Analysis of the Packaging Machine Investment 2017 2018 2019 2020 2021 2022 2023 2024 2025 2020 2025 2 3 4 5 6 7 8 10 11 12 13 2015 2016 Inflation Rate = 1.50% Years from Now 0 1 Iftar River Waite Three years to Purchase the Machine Maintenance Labor Overtime Depreciation Total Cort Tx@345 After-tax Cost - Depreciation - Cap. Expenditure Annual Free Casa Flow NPV@WACC = Iftar River Purchases the New Machine Now Maiat Labor Depreciation Total Cort Txx @ 245 After-tax Cost - Depresiztion - Cap. Expend Tax Shield on Writeoff of Old Annual Free Cash Flow NPV@ WACC = Advantage of Waiting NPV (Wait) - NPV (Now) = This talle tells you to Buy Now or to wait to make the Packaging Frucase. Tetepret your decision in a memo to Adelise Kols cops Esmoad Lim... You are Andy Chin 0 0 0 0 0 0 0 0 0 0 0 0 FCF (Wit) - FCF Now NPV Gain from Waiting Exhibit 1 Star River Electronics Ltd. Historical Income Statements Fiscal Year Ended June 30 (SGD 000) 2012 2013 80,115 2014 92,613 2015 106,042 71,924 Sales Operating expenses: Production costs and expenses Admin and selling expenses Depreciation Total operating expenses 33,703 16,733 8,076 58,512 38,393 17,787 9,028 65,208 46,492 21,301 10,392 78,185 53,445 24,633 11,360 89,438 Operating profit Interest expense Earnings before taxes Income taxes Net earnings Dividends to all common shares Retentions of earnings 13,412 3,487 9,925 2,430 7,495 14,907 3,929 10,978 2,705 8,273 14,428 6,227 8,201 1.925 6,276 16,604 7,614 8,990 2,220 6,770 2.000 5,495 2,000 6,273 2,000 4,276 2,000 4,770 Exhibit 2 Star River Electronics Ltd. Historical Balance Sheets Fiscal Year Ended June 30) (SGD 000) 2012 2013 2014 2015 Assets: Cash Accounts receivable Inventories Total current assets Gross property, plant & equipment Accumulated depreciation Net property, plant & equipment Total assets 4,816 22,148 23,301 50,265 64,611 4.559 60,052 110,317 5,670 25,364 27,662 58,696 80,153 13,587 66,566 125,262 5,090 28,078 53,828 86,996 97,899 23,979 73,920 160,916 5,795 35,486 63,778 105,059 115,153 (35,339 79,814 184,873 Liabilities and stockholders' equity: Short-term borrowings (bank) Accounts payable Other accrued liabilities Total current liabilities Long-term debe Shareholders' equity Total liabilities and stockholders' equity 29,002 12,315 24,608 65,925 10,000 34,391 110,316 35,462 12,806 26,330 74,598 10,000 40,664 125,262 69,005 11,890 25,081 105,976 10,000 44,940 160,916 82.275 13,370 21,318 116,963 18,200 49.710 184,873 Exhibit 3 Star River Electronics Ltd. Ratio Analyses of Historical Financial Statements Fiscal Year Ended June 30 2012 2013 2014 2015 Profitability Operating margin Tax rate Return on sales Return on equity Return on assets 18.6% 24.5% 10.4% 21.8% 6.8% 18.6% 24.6% 10.3% 20.3% 6.6% 15.6% 23.5% 6.8% 14.0% 3.9% 15.7% 24.7% 6.4% 13.6% 3.7% 1.76 Leverage Debt/equity ratio Debt/total capital EBIT/interest 1.13 0.53 3.85 1.12 0.53 3.79 0.64 2.32 2.02 0.67 2.18 Asset Utilization Sales/assets Sales growth rate Assets growth rate Days sales outstanding Days payable outstanding Days inventory outstanding 65.2% 15.0% 8.0% 112.4 133.4 252.3 64.0% 11.4% 13.5% 115.6 121.7 263.0 57.6% 15.6% 28.5% 110.7 93.3 422.6 57.4% 14.5% 14.9% 122.1 91.3 435.6 Liquidity Current ratio Quick ratio 0.76 0.79 0.42 0.82 0.31 0.90 0.35 0.41 Exhibit 5 Star River Electronics Ltd. Data on Comparable Companies Percent Sales Price/ from Optical Media Earnings Production Ratio 20% 9.0 95% NMF 90% 18.2 30% 34.6 60% NMF Name Sing Studios, Inc. Wintronics, Inc. STOR-Max Corp. Digital Media Corp Wymax, Inc. Number of Shares Last Annual Outstanding Dividend (millions) per Share 9.3 1.82 177.2 0.15 Book Book Value Debt/Equity per Share 0.23 1.24 1.72 1.46 1.33 7.06 0.00 17.75 0.42 6.95 Beta 1.10 1.50 1.70 1.20 1.50 Market Price per Share 1.37 6.39 27.48 75.22 22.19 8.9 none 48.3 371.2 none 1.57 Note: NMF means not a meaningful Eiguace. This arises when a company's earnings or projected earnings are negative. Exhibit TN2 Analysis of the Packaging Machine Investment 2017 2018 2019 2020 2021 2022 2023 2024 2025 2020 2025 2 3 4 5 6 7 8 10 11 12 13 2015 2016 Inflation Rate = 1.50% Years from Now 0 1 Iftar River Waite Three years to Purchase the Machine Maintenance Labor Overtime Depreciation Total Cort Tx@345 After-tax Cost - Depreciation - Cap. Expenditure Annual Free Casa Flow NPV@WACC = Iftar River Purchases the New Machine Now Maiat Labor Depreciation Total Cort Txx @ 245 After-tax Cost - Depresiztion - Cap. Expend Tax Shield on Writeoff of Old Annual Free Cash Flow NPV@ WACC = Advantage of Waiting NPV (Wait) - NPV (Now) = This talle tells you to Buy Now or to wait to make the Packaging Frucase. Tetepret your decision in a memo to Adelise Kols cops Esmoad Lim... You are Andy Chin 0 0 0 0 0 0 0 0 0 0 0 0 FCF (Wit) - FCF Now NPV Gain from Waiting Exhibit 1 Star River Electronics Ltd. Historical Income Statements Fiscal Year Ended June 30 (SGD 000) 2012 2013 80,115 2014 92,613 2015 106,042 71,924 Sales Operating expenses: Production costs and expenses Admin and selling expenses Depreciation Total operating expenses 33,703 16,733 8,076 58,512 38,393 17,787 9,028 65,208 46,492 21,301 10,392 78,185 53,445 24,633 11,360 89,438 Operating profit Interest expense Earnings before taxes Income taxes Net earnings Dividends to all common shares Retentions of earnings 13,412 3,487 9,925 2,430 7,495 14,907 3,929 10,978 2,705 8,273 14,428 6,227 8,201 1.925 6,276 16,604 7,614 8,990 2,220 6,770 2.000 5,495 2,000 6,273 2,000 4,276 2,000 4,770 Exhibit 2 Star River Electronics Ltd. Historical Balance Sheets Fiscal Year Ended June 30) (SGD 000) 2012 2013 2014 2015 Assets: Cash Accounts receivable Inventories Total current assets Gross property, plant & equipment Accumulated depreciation Net property, plant & equipment Total assets 4,816 22,148 23,301 50,265 64,611 4.559 60,052 110,317 5,670 25,364 27,662 58,696 80,153 13,587 66,566 125,262 5,090 28,078 53,828 86,996 97,899 23,979 73,920 160,916 5,795 35,486 63,778 105,059 115,153 (35,339 79,814 184,873 Liabilities and stockholders' equity: Short-term borrowings (bank) Accounts payable Other accrued liabilities Total current liabilities Long-term debe Shareholders' equity Total liabilities and stockholders' equity 29,002 12,315 24,608 65,925 10,000 34,391 110,316 35,462 12,806 26,330 74,598 10,000 40,664 125,262 69,005 11,890 25,081 105,976 10,000 44,940 160,916 82.275 13,370 21,318 116,963 18,200 49.710 184,873 Exhibit 3 Star River Electronics Ltd. Ratio Analyses of Historical Financial Statements Fiscal Year Ended June 30 2012 2013 2014 2015 Profitability Operating margin Tax rate Return on sales Return on equity Return on assets 18.6% 24.5% 10.4% 21.8% 6.8% 18.6% 24.6% 10.3% 20.3% 6.6% 15.6% 23.5% 6.8% 14.0% 3.9% 15.7% 24.7% 6.4% 13.6% 3.7% 1.76 Leverage Debt/equity ratio Debt/total capital EBIT/interest 1.13 0.53 3.85 1.12 0.53 3.79 0.64 2.32 2.02 0.67 2.18 Asset Utilization Sales/assets Sales growth rate Assets growth rate Days sales outstanding Days payable outstanding Days inventory outstanding 65.2% 15.0% 8.0% 112.4 133.4 252.3 64.0% 11.4% 13.5% 115.6 121.7 263.0 57.6% 15.6% 28.5% 110.7 93.3 422.6 57.4% 14.5% 14.9% 122.1 91.3 435.6 Liquidity Current ratio Quick ratio 0.76 0.79 0.42 0.82 0.31 0.90 0.35 0.41 Exhibit 5 Star River Electronics Ltd. Data on Comparable Companies Percent Sales Price/ from Optical Media Earnings Production Ratio 20% 9.0 95% NMF 90% 18.2 30% 34.6 60% NMF Name Sing Studios, Inc. Wintronics, Inc. STOR-Max Corp. Digital Media Corp Wymax, Inc. Number of Shares Last Annual Outstanding Dividend (millions) per Share 9.3 1.82 177.2 0.15 Book Book Value Debt/Equity per Share 0.23 1.24 1.72 1.46 1.33 7.06 0.00 17.75 0.42 6.95 Beta 1.10 1.50 1.70 1.20 1.50 Market Price per Share 1.37 6.39 27.48 75.22 22.19 8.9 none 48.3 371.2 none 1.57 Note: NMF means not a meaningful Eiguace. This arises when a company's earnings or projected earnings are negative
Step by Step Solution
There are 3 Steps involved in it

Get step-by-step solutions from verified subject matter experts