

Question: Use the CAPM to find the expected return for TARGET. CAPM inputs should be as follows: Beta () use the estimate from this assignment Market
Use the CAPM to find the expected return for TARGET. CAPM inputs should be as follows:
Beta () use the estimate from this assignment
Market return E(RM) take the average of the S&P percentage holding period returns
from the spreadsheet
Risk free rate Rf assume a risk free rate of 2% per year
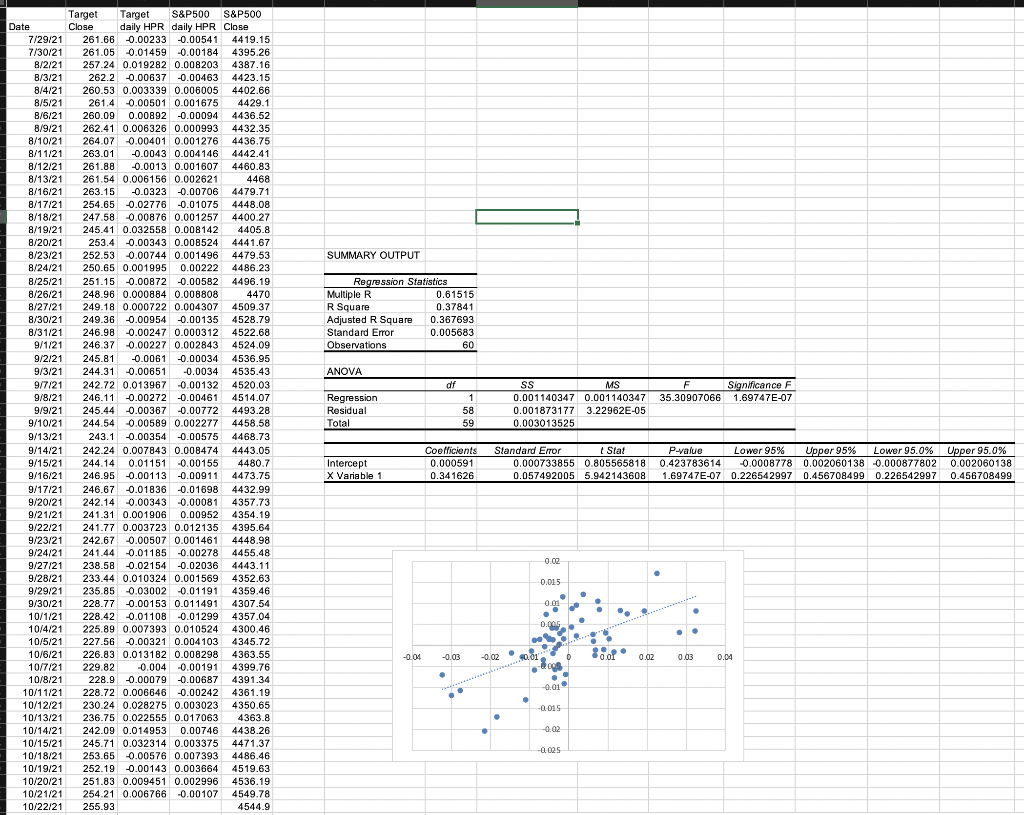
SUMMARY OUTPUT Regression Statistics Multiple R 0.61515 R Square 0.37841 Adjusted R Square 0.367693 Standard Error 0.005683 Observations 60 ANOVA df F Significance F 35.30907066 1.69747E-07 1 Date 7/29/21 7/30/21 8/2/21 8/3/21 8/4/21 8/5/21 8/6/21 8/9/21 8/10/21 8/11/21 8/12/21 8/13/21 8/16/21 8/17/21 8/18/21 8/19/21 8/20/21 8/23/21 8/24/21 8/25/21 8/26/21 8/27/21 8/30/21 8/31/21 9/1/21 9/2/21 9/3/21 9/7/21 9/8/21 9/9/21 9/10/21 9/13/21 9/14/21 9/15/21 9/16/21 9/17/21 9/20/21 9/21/21 9/22/21 9/23/21 9/24/21 9/27/21 9/28/21 9/29/21 9/30/21 10/1/21 10/4/21 10/5/21 10/6/21 10/7/21 10/8/21 10/11/21 10/12/21 10/13/21 10/14/21 10/15/21 10/18/21 10/19/21 10/20/21 10/21/21 10/22/21 Target Target S&P500 S&P500 Close daily HPR daily HPR Close 261.66 0.00233 -0.00541 44 19.15 261.05 0.01459 -0.00184 4395.26 257.24 0.019282 0.008203 4387.16 262.2 -0.00637 -0.00463 4423.15 260.53 0.003339 0.006005 4402.66 261.4 -0.00501 0.001675 4429.1 260.09 0.00892 -0.00094 4436.52 262.41 0.006326 0.000993 4432.35 264.07 -0.00401 0.001276 4436.75 263.01 -0.0043 0.004146 4442.41 261.88 -0.0013 0.001607 4460.83 261.54 0.006156 0.002621 4468 263.15 -0.0323 -0.00706 4479.71 254.65 -0.02776 -0.01075 4448.08 247.58 -0.00876 0.001257 4400.27 245.41 0.032558 0.008142 4405.8 253.4 -0.00343 0.008524 4441.67 252.53 0.00744 0.001496 4479.53 250.65 0.001995 0.00222 4486.23 251.15 -0.00872 -0.00582 4496.19 248.96 0.000884 0.008808 4470 249.18 0.000722 0.004307 4509.37 249.36 0.00954 -0.00135 4528.79 246.98 -0.00247 0.000312 4522.68 246.37 0.00227 0.002843 4524.09 245.81 -0.0061 -0.00034 4536.95 244.31 -0.00651 -0.0034 4535.43 242.72 0.013967 -0.00132 4520.03 246.11 -0.00272 -0.00461 4514.07 245.44 -0.00367 -0.00772 4493.28 244.54 -0.00589 0.002277 4458.58 243.1 -0.00354 -0.00575 4468.73 242.24 0.007843 0.008474 4443.05 244.14 0.01151 0.00155 4480.7 246.95 -0.00113 -0.00911 4473.75 246.67 -0.01836 -0.01698 4432.99 242.14 -0.00343 0.00081 4357.73 241.31 0.001906 0.00952 4354.19 241.77 0.003723 0.012135 4395.64 242.67 -0.00507 0.001461 4448.98 241.44 -0.01185 -0.00278 4455.48 238.58 -0.02154 -0.02036 4443.11 233.44 0.010324 0.001569 4352.63 235.85 -0.03002 -0.01191 4359.46 228.77 -0.00153 0.011491 4307.54 228.42 0.01108 -0.01299 4357.04 225.89 0.007393 0.010524 4300.46 227.56 0.00321 0.004103 4345.72 226.83 0.013182 0.008298 4363.55 229.82 -0.004 -0.00191 4399.76 228.9 0.00079 -0.00687 4391.34 228.72 0.006646 -0.00242 4361.19 230.24 0.028275 0.003023 4350.65 236.75 0.022555 0.017063 4363.8 242.09 0.014953 0.00746 4438.26 245.71 0.032314 0.003375 4471.37 253.65 0.00576 0.007393 4486.46 252.19 0.00143 0.003664 4519.63 251.83 0.009451 0.002996 4536.19 254.21 0.006766 -0.00107 4549.78 255.93 4544.9 SS MS 0.001140347 0.001140347 0.001873177 3.22962E-05 0.003013525 Regression Residual Total 58 59 Intercept X Variable 1 Coefficients 0.000591 0.341626 Standard Error Stat 0.000733855 0.805565818 0.057492005 5.942143608 P-value Lower 95% Uoper 95% Lower 95.0% Upper 95.0% 0.423783614 0.0008778 0.002060138 -0.000877802 0.002060138 1.69747E-07 0.226542997 0.456708499 0.226542997 0.456708499 0.02 . 0.015 . . 0.01 . 0.005 2 20 -0.04 -0.03 20 0.01 0.02 0.03 0.04 -0.02 0.01 0 200 -0.01 -2015 -0.025
Step by Step Solution
There are 3 Steps involved in it

Get step-by-step solutions from verified subject matter experts