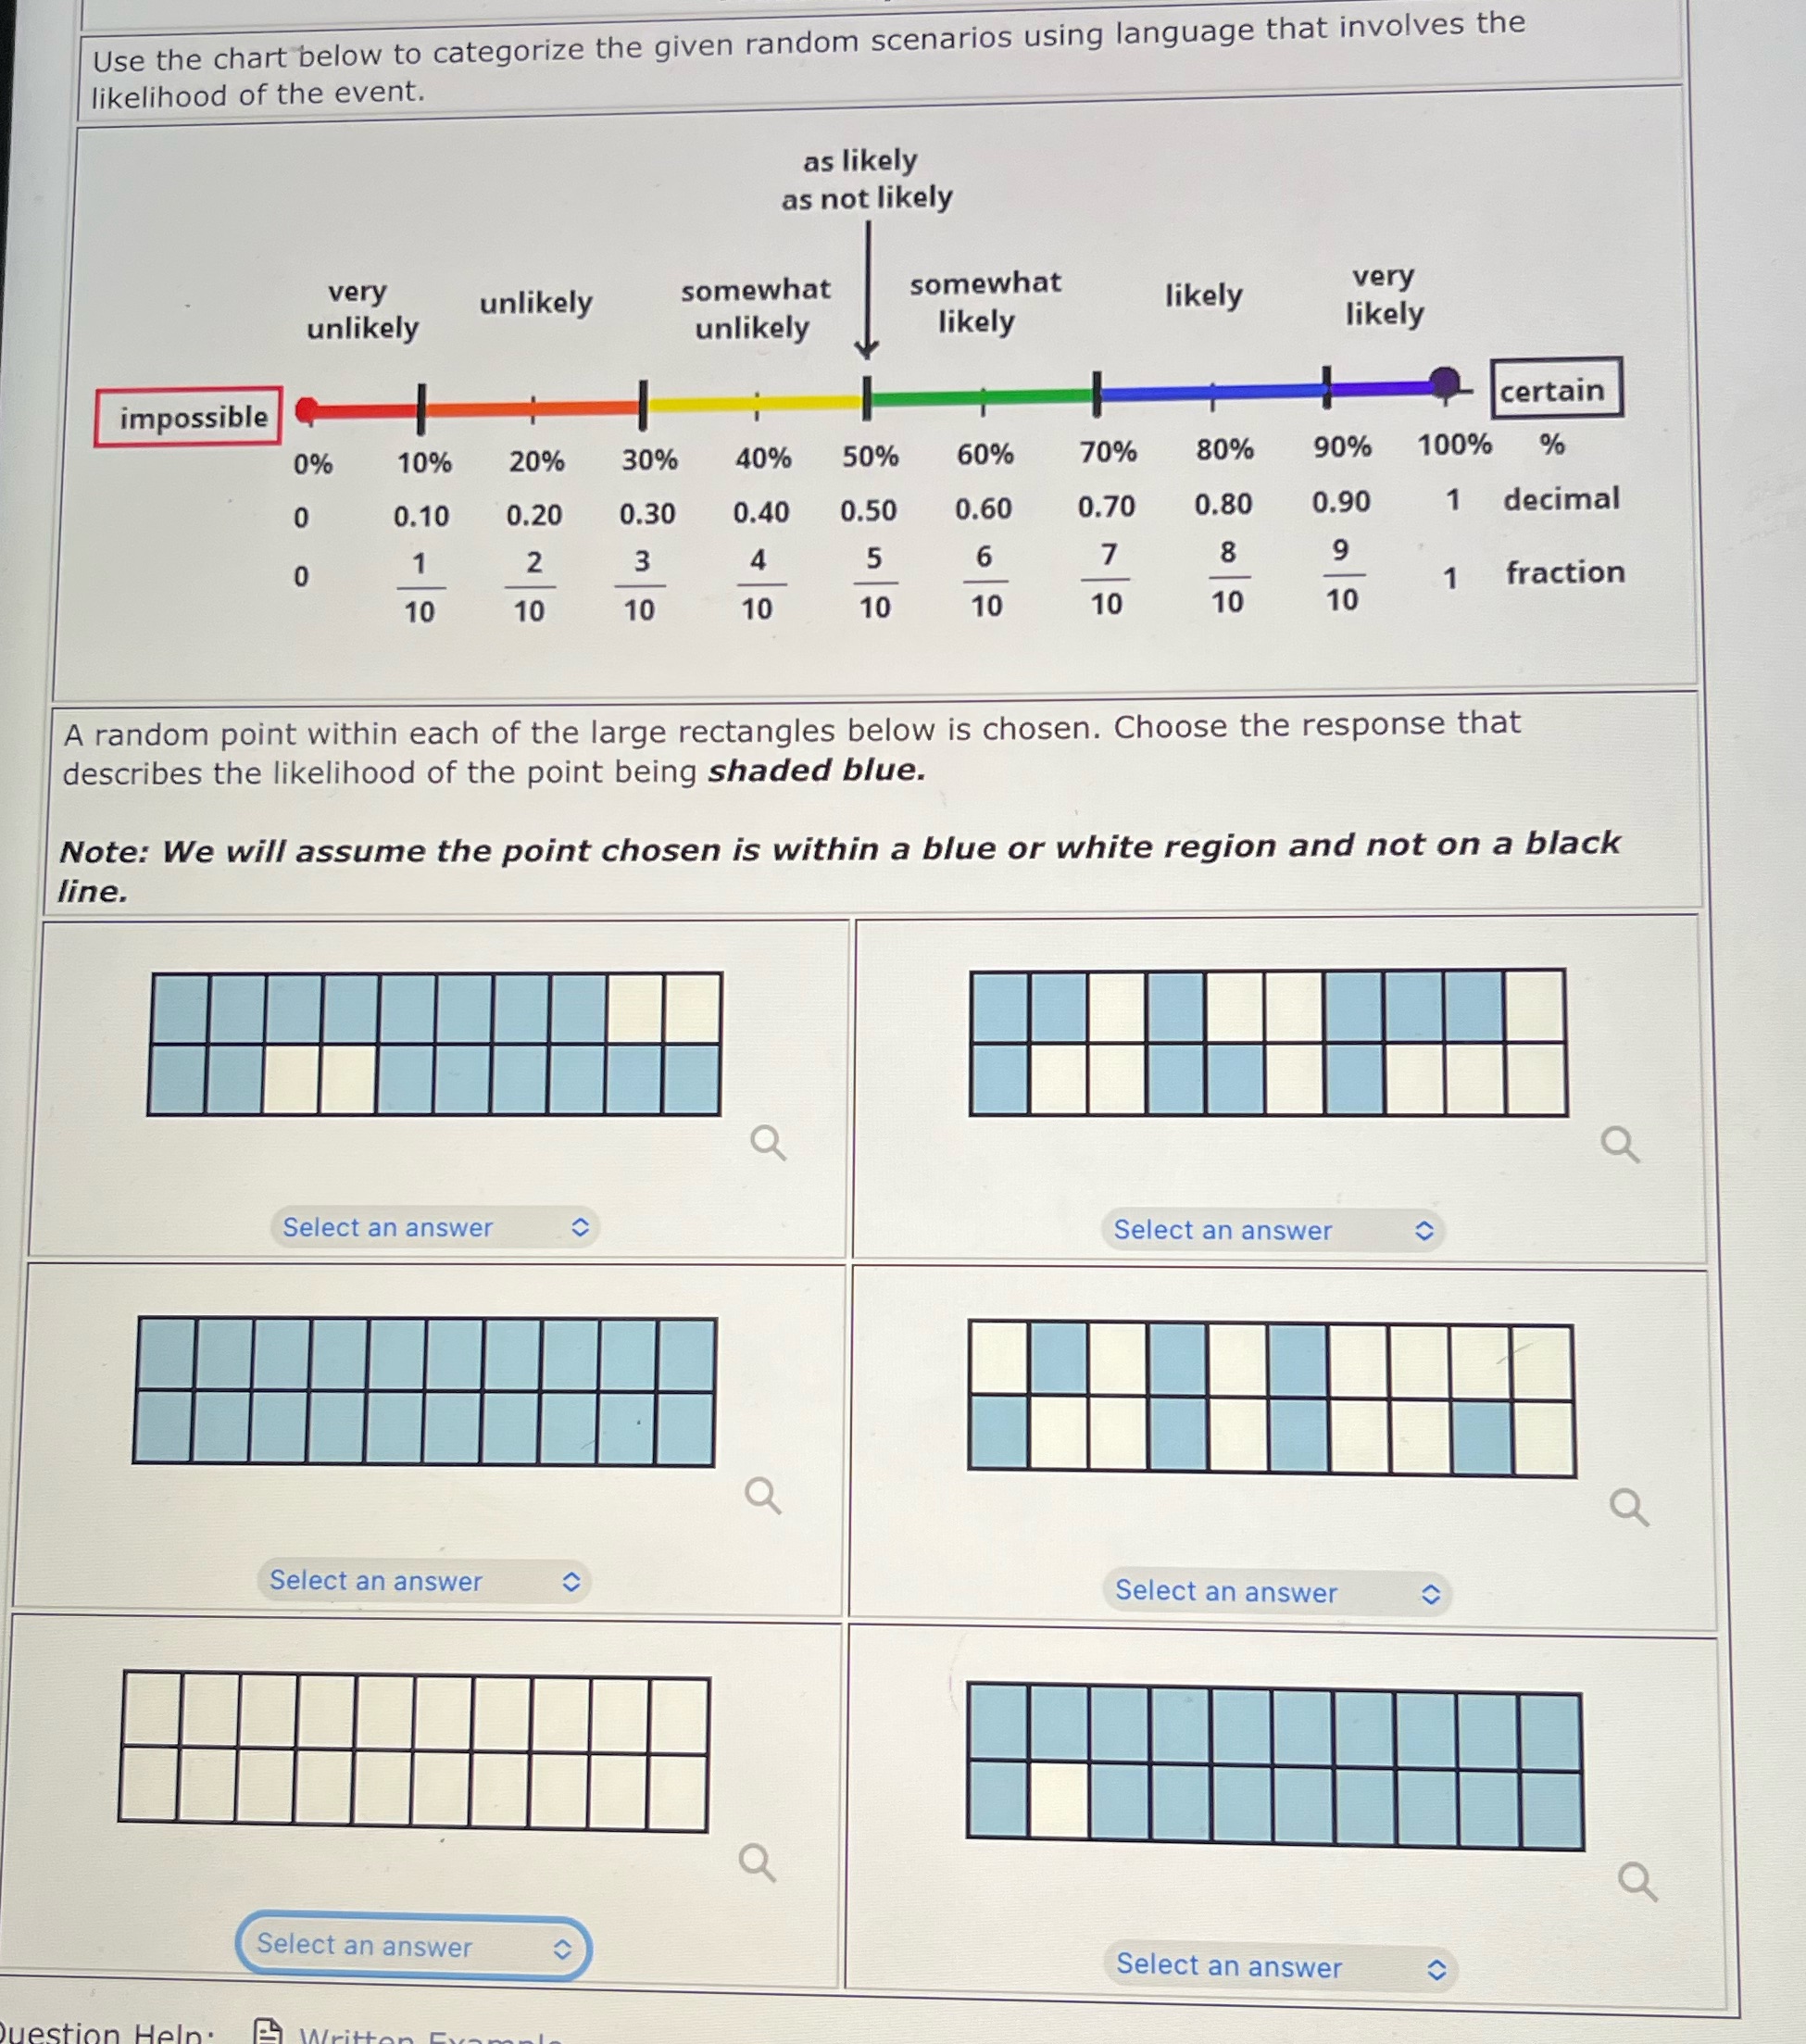
Question: Use the chart below to categorize the given random scenarios using language that involves the likelihood of the event. as likely as not likely very

Use the chart below to categorize the given
Use the chart below to categorize the given random scenarios using language that involves the likelihood of the event. as likely as not likely very very unlikely somewhat somewhat likely likely unlikely unlikely likely certain impossible 80% 90% 100% % 0% 10% 20% 30% 40% 50% 60% 70% 0.60 0.70 0.80 0.90 1 decimal 0 0.10 0.20 0.30 0.40 0.50 5 8 9 0 2 1 fraction 10 10 10 10 10 10 10 10 10 A random point within each of the large rectangles below is chosen. Choose the response that describes the likelihood of the point being shaded blue. Note: We will assume the point chosen is within a blue or white region and not on a black line. Q Select an answer C Select an answer C Q Q Select an answer Select an answer C Q Q Select an answer Select an

Step by Step Solution

There are 3 Steps involved in it

1 Expert Approved Answer
Step: 1 Unlock blur-text-image
Question Has Been Solved by an Expert!

Get step-by-step solutions from verified subject matter experts

Step: 2 Unlock
Step: 3 Unlock

Students Have Also Explored These Related Mathematics Questions!