

Question: use the chart to answer b and c begin{tabular}{|c|l|c|c|c|} hline a) & multicolumn{4}{|c|}{ 10-Year Sovereign Rates, Ratings & Outlook } hline & Country &
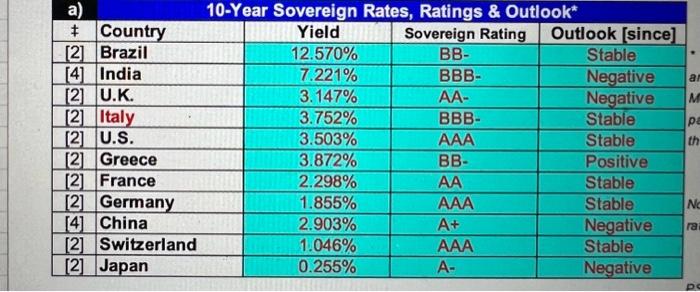
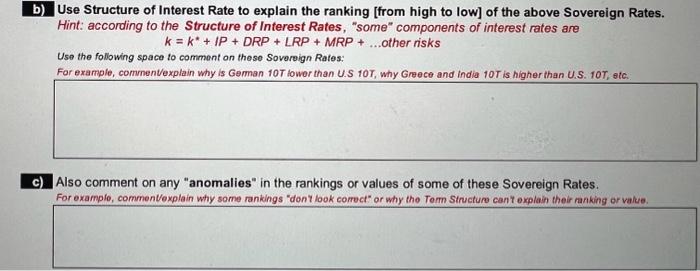
\begin{tabular}{|c|l|c|c|c|} \hline a) & \multicolumn{4}{|c|}{ 10-Year Sovereign Rates, Ratings \& Outlook } \\ \hline & Country & Yield & Sovereign Rating & Outlook [since] \\ \hline[2] & Brazil & 12.570% & BB- & Stable \\ \hline[4] & India & 7.221% & BBB- & Negative \\ \hline[2] & U.K. & 3.147% & AA- & Negative \\ \hline[2] & Italy & 3.752% & BBB- & Stable \\ \hline[2] & U.S. & 3.503% & AAA & Stable \\ \hline[2] & Greece & 3.872% & BB- & Positive \\ \hline[2] & France & 2.298% & AA & Stable \\ \hline[2] & Germany & 1.855% & AAA & Stable \\ \hline[4] & China & 2.903% & A+ & Negative \\ \hline[2] & Switzerland & 1.046% & AAA & Stable \\ \hline[2] & Japan & 0.255% & A- & Negative \\ \hline \end{tabular} Use Structure of Interest Rate to explain the ranking [from high to low] of the above Sovereign Rates. Hint: according to the Structure of Interest Rates, "some" components of interest rates are k=k+IP+DRP+LRP+MRP+otherrisks Use the following space to comment on these Soveroign Rates: For example, commenVexplain why is Geman 10T tower than U.S 10T, why Greece and india 10T is hiaher than U.S. 10T. etc. Also comment on any "anomalies" in the rankings or values of some of these Sovereign Rates. For example, commenVexplain why some rankings "don t look comect" or why the Torm Structure cant explain their nankind or value
Step by Step Solution
There are 3 Steps involved in it

Get step-by-step solutions from verified subject matter experts