

Question: Use the code henon_iteration.m from the Files tab in the Matlab channel on Teams to recreate figure 2.17. In addition, find and plot a periodic
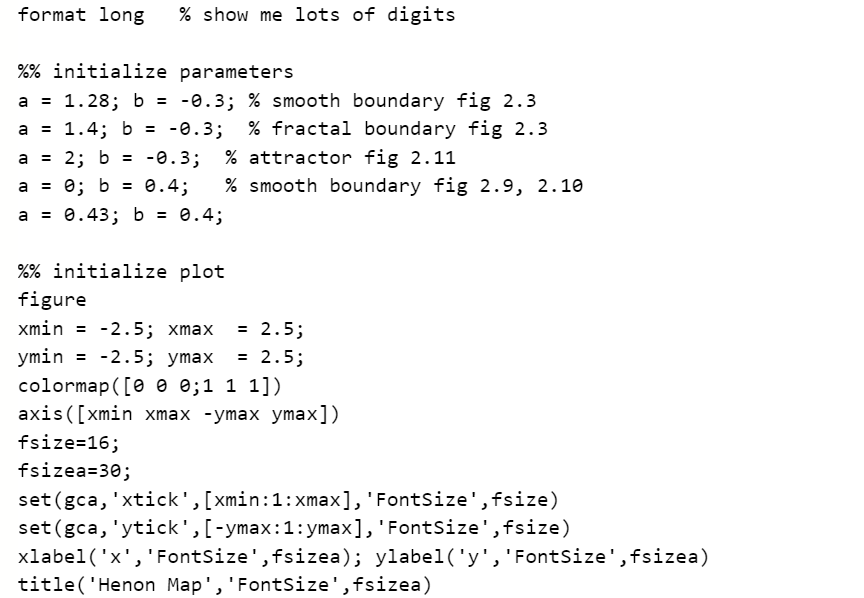
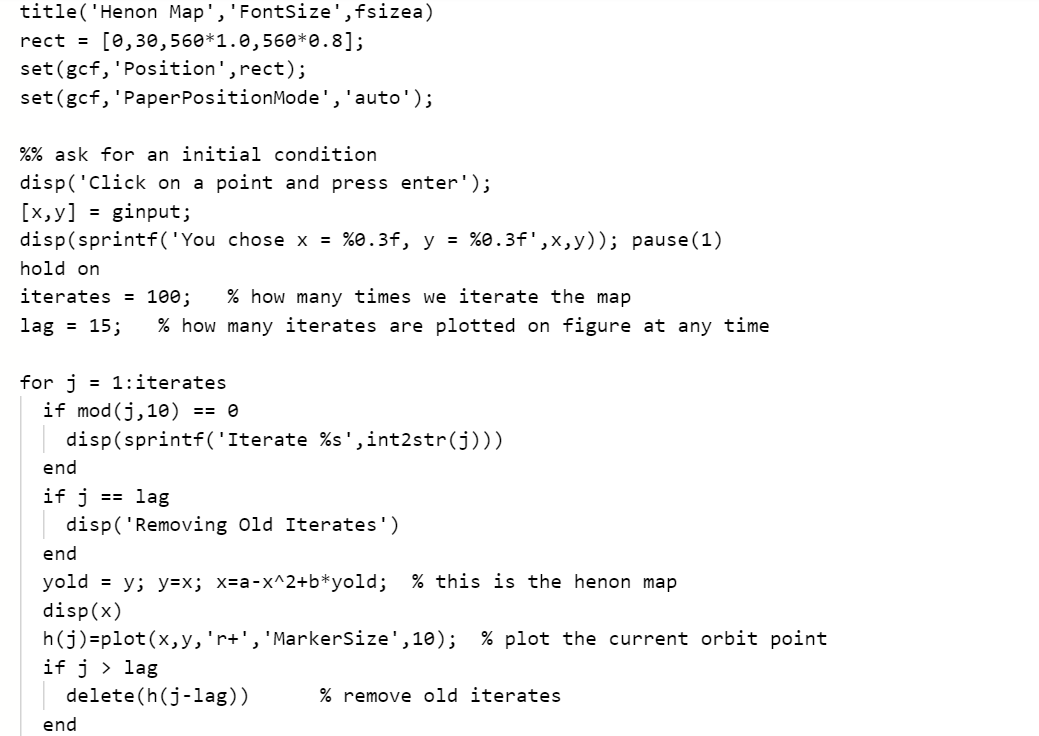

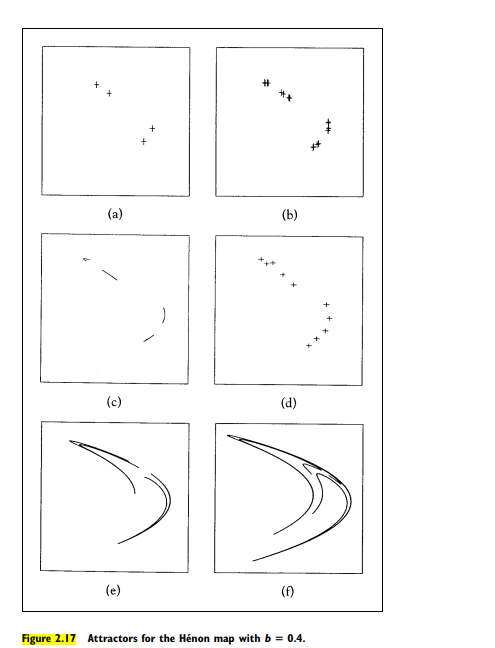
Use the code henon_iteration.m from the Files tab in the Matlab channel on Teams to recreate figure 2.17. In addition, find and plot a periodic orbit higher than period-16 (panel b). To do so, you'll need to increase the number of iterates performed by the code, as well as the lag parameter specifying how many points are plotted. format long % show me lots of digits a II %% initialize parameters a = 1.28; b = -0.3; % smooth boundary fig 2.3 1.4; b = -0.3; % fractal boundary fig 2.3 = 2; b = -0.3; % attractor fig 2.11 a = b; b = 0.4; % smooth boundary fig 2.9, 2.10 a = 0.43; b = 0.4; a %% initialize plot figure xmin -2.5; xmax = 2.5; ymin = -2.5; ymax = 2.5; colormap( [0 0 0;1 1 1]) axis ([xmin xmax -ymax ymax]) fsize=16; fsizea=30; set(gca,'xtick', [xmin:1:xmax], 'FontSize', fsize) set(gca, 'ytick', [-ymax: 1:ymax], 'FontSize', fsize) xlabel('x', 'FontSize', fsizea); ylabel('y', 'FontSize', fsizea) title('Henon Map', 'FontSize', fsizea) title('Henon Map', 'FontSize', fsizea) rect = [0,30,560*1.0,560*0.8]; set(gcf, 'Position',rect); set(gcf, 'Paper PositionMode', 'auto'); %% ask for an initial condition disp('click on a point and press enter'); [x,y] ginput; disp(sprintf('You chose x = %0.3f, y = %0.3f',x,y)); pause(1) hold on iterates = 100; % how many times we iterate the map lag = 15; % how many iterates are plotted on figure at any time == for j = 1:iterates if mod(j, 10) == 0 disp(sprintf('Iterate %s', int2str(j))) end if j lag disp('Removing old Iterates') end yold = y; y=x; X=a-x^2+b*yold; % this is the henon map disp(x) h(j)=plot(x,y,'rt', 'MarkerSize',10); % plot the current orbit point if j > lag delete(h(j-lag)) % remove old iterates end % pause for drama, remove for insane speed pause(.1) end (a) (b) (c) (d) (e) (f) Figure 2.17 Attractors for the Hnon map with b = 0.4. Use the code henon_iteration.m from the Files tab in the Matlab channel on Teams to recreate figure 2.17. In addition, find and plot a periodic orbit higher than period-16 (panel b). To do so, you'll need to increase the number of iterates performed by the code, as well as the lag parameter specifying how many points are plotted. format long % show me lots of digits a II %% initialize parameters a = 1.28; b = -0.3; % smooth boundary fig 2.3 1.4; b = -0.3; % fractal boundary fig 2.3 = 2; b = -0.3; % attractor fig 2.11 a = b; b = 0.4; % smooth boundary fig 2.9, 2.10 a = 0.43; b = 0.4; a %% initialize plot figure xmin -2.5; xmax = 2.5; ymin = -2.5; ymax = 2.5; colormap( [0 0 0;1 1 1]) axis ([xmin xmax -ymax ymax]) fsize=16; fsizea=30; set(gca,'xtick', [xmin:1:xmax], 'FontSize', fsize) set(gca, 'ytick', [-ymax: 1:ymax], 'FontSize', fsize) xlabel('x', 'FontSize', fsizea); ylabel('y', 'FontSize', fsizea) title('Henon Map', 'FontSize', fsizea) title('Henon Map', 'FontSize', fsizea) rect = [0,30,560*1.0,560*0.8]; set(gcf, 'Position',rect); set(gcf, 'Paper PositionMode', 'auto'); %% ask for an initial condition disp('click on a point and press enter'); [x,y] ginput; disp(sprintf('You chose x = %0.3f, y = %0.3f',x,y)); pause(1) hold on iterates = 100; % how many times we iterate the map lag = 15; % how many iterates are plotted on figure at any time == for j = 1:iterates if mod(j, 10) == 0 disp(sprintf('Iterate %s', int2str(j))) end if j lag disp('Removing old Iterates') end yold = y; y=x; X=a-x^2+b*yold; % this is the henon map disp(x) h(j)=plot(x,y,'rt', 'MarkerSize',10); % plot the current orbit point if j > lag delete(h(j-lag)) % remove old iterates end % pause for drama, remove for insane speed pause(.1) end (a) (b) (c) (d) (e) (f) Figure 2.17 Attractors for the Hnon map with b = 0.4
Step by Step Solution
There are 3 Steps involved in it

Get step-by-step solutions from verified subject matter experts