

Question: Use the data and calculations above to create a data table below that will be used to graph of costs, profits and volume. ost-Volume-Profit: Break-Even
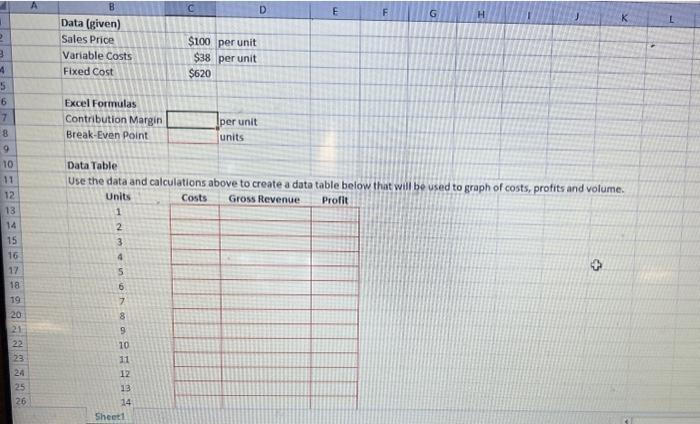
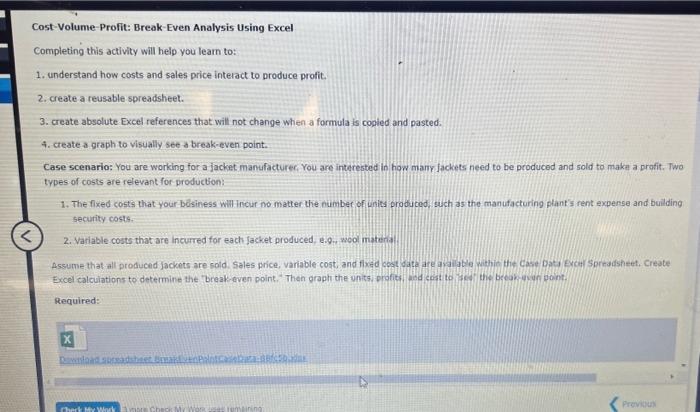
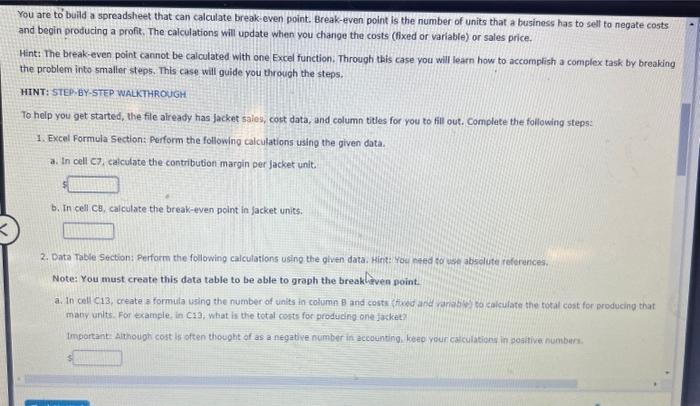
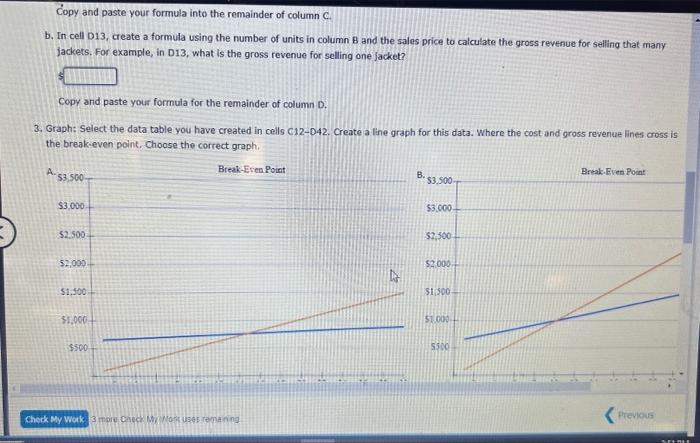
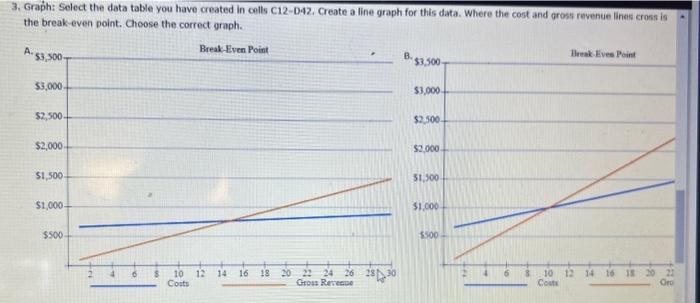
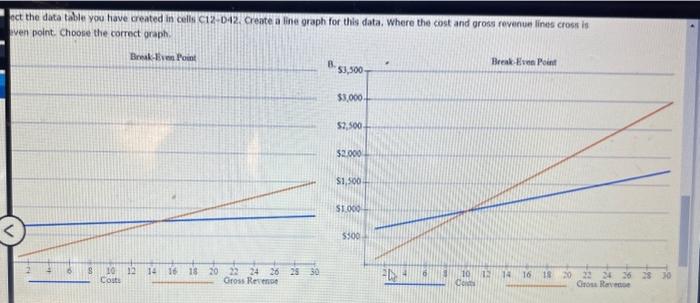
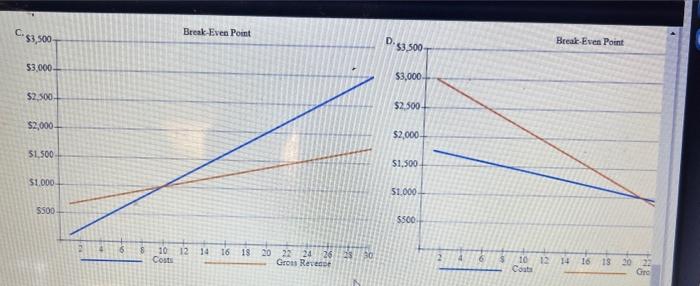
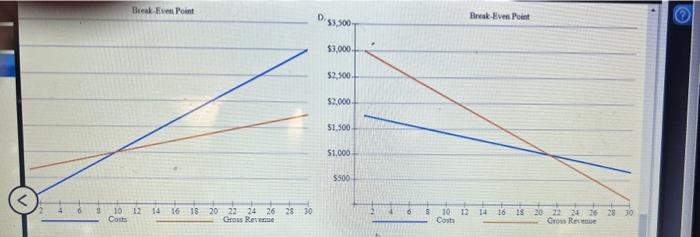
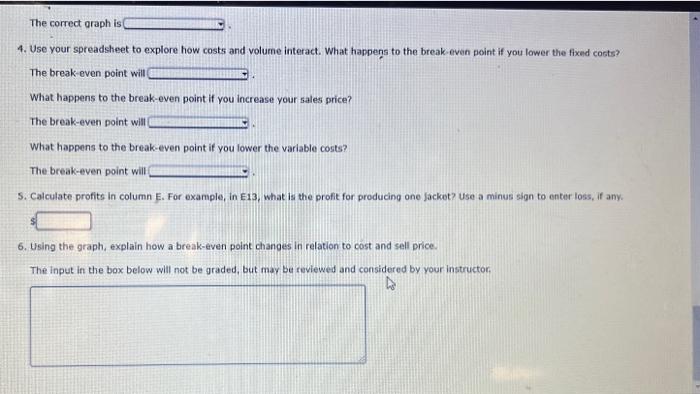
Use the data and calculations above to create a data table below that will be used to graph of costs, profits and volume. ost-Volume-Profit: Break-Even Analysis Using Excel Completing this activity will help you leam to: Understand how costs and sales price interact to produce profit. 2. create a reusable spreadsheet. 3. create absolute Excel references that will not change when a formula is cogled and pasted. 4. create a graph to visually see a break-even point. Case scenario: You are working for a jacket manufacture, You are interested in how many lackets need to be produced and sold to make a profit, Two types of costs are relevant for producton: 1. The fixed costs that your besiness winincur no matter the number of inits produted, such as the manufacturing plant's rent expense and building security costs. 2. Variable costs that are incurred for each Jacket produced, e.9. wool matenid Assume that all produced Jackets are sold. Sales price, variable cost, and fixed cest data are arillal withis the case bata Excer Sorradsheet, Create Excel calculations to determine the Zreak quen point," Then graph the units, profits, ahd cost to zed the break-ieny pont. Required: You are to buid a spreadsheet that can calculate break-even point. Break-even point is the number of units that a business has to selt to negate costs and begin producing a profit. The calculations will update when you change the costs (lixed or variable) or sales price. Hint: The break-even point cannot be calculated with one Excel function. Through this case you will learn how to accomplish a complex task by breaking the problem into smaller steps. This case will guide you through the steps. HINT:STEPVBY-STEP WALKTHROUGH To help you get started, the file already has jacket sales, cost data, and column titles for you to fill out. Complete the following steps: 1. Excel Formula Section: Perform the following calculations using the given data. a. In cell c7. calculate the contribution margin per jacket unit. b. In cell cs, calculate the break-even point in jacket units. 2. Data Table Scction: Perform the following calculations using the given data. kirt: You nesd to wase absolute references. Note: You must create this data table to be oble to graph the break frven point: a. In cell C13, create a formula uaing the number of uinits in column A and costs fficed and rariabley co calculate the rotal cost for producing that macy units. For example, in C13; what in the total corts for produdng one jacket? Important Althougti cost is often thought of as a negative number in accoenting, kee your caiculations in positive numbura. Copy and paste your formula into the remainder of column C. b. In cell D13, create a formula using the number of units in column B and the sales price to calculate the gross revenue for selling that many jackets. For example, in D13, what is the gross revenue for selling one Jacket? Copy and paste your formula for the remainder of column D. 3. Graph: Select the data table you have created in cells C12D2. Create a line graph for this data. Where the cost and gross revenue lines cross is the break-even point, Choose the correct graph. 3 rtu checr Mo. pori uso s roma ning 3. Graph: Select the data table you have created in colts C12-D42. Create a line graph for this data. Where the cost and grosu revenue linas cross is the break-even point. Choose the correct graph. act the data table you have created in celli C12-D42. Create a line graph for this data. Where the cost and aross revenue lines cross is ven point. Choose the corroct oraph. C. D. 53,500 Break-Even Point 4. Use your spreadsheet to explore how costs and volume interact. What happens to the break-even point if you lower the fixed costs? The break-even point will What happens to the break-even point if you increase your sales price? The break-even point will What happens to the break-even point if you lower the variable costs? The break-even point will 5. Calculate profits in column E. For example, in E13, what is the profit for producing one Jacket? Use a minus sign to enter loss, if any. 6. Using the graph, explain how a break-even point changes in relation to cost and sell price. The inpet in the box below will not be graded, but may be reviewed and considered by your instructor: Use the data and calculations above to create a data table below that will be used to graph of costs, profits and volume. ost-Volume-Profit: Break-Even Analysis Using Excel Completing this activity will help you leam to: Understand how costs and sales price interact to produce profit. 2. create a reusable spreadsheet. 3. create absolute Excel references that will not change when a formula is cogled and pasted. 4. create a graph to visually see a break-even point. Case scenario: You are working for a jacket manufacture, You are interested in how many lackets need to be produced and sold to make a profit, Two types of costs are relevant for producton: 1. The fixed costs that your besiness winincur no matter the number of inits produted, such as the manufacturing plant's rent expense and building security costs. 2. Variable costs that are incurred for each Jacket produced, e.9. wool matenid Assume that all produced Jackets are sold. Sales price, variable cost, and fixed cest data are arillal withis the case bata Excer Sorradsheet, Create Excel calculations to determine the Zreak quen point," Then graph the units, profits, ahd cost to zed the break-ieny pont. Required: You are to buid a spreadsheet that can calculate break-even point. Break-even point is the number of units that a business has to selt to negate costs and begin producing a profit. The calculations will update when you change the costs (lixed or variable) or sales price. Hint: The break-even point cannot be calculated with one Excel function. Through this case you will learn how to accomplish a complex task by breaking the problem into smaller steps. This case will guide you through the steps. HINT:STEPVBY-STEP WALKTHROUGH To help you get started, the file already has jacket sales, cost data, and column titles for you to fill out. Complete the following steps: 1. Excel Formula Section: Perform the following calculations using the given data. a. In cell c7. calculate the contribution margin per jacket unit. b. In cell cs, calculate the break-even point in jacket units. 2. Data Table Scction: Perform the following calculations using the given data. kirt: You nesd to wase absolute references. Note: You must create this data table to be oble to graph the break frven point: a. In cell C13, create a formula uaing the number of uinits in column A and costs fficed and rariabley co calculate the rotal cost for producing that macy units. For example, in C13; what in the total corts for produdng one jacket? Important Althougti cost is often thought of as a negative number in accoenting, kee your caiculations in positive numbura. Copy and paste your formula into the remainder of column C. b. In cell D13, create a formula using the number of units in column B and the sales price to calculate the gross revenue for selling that many jackets. For example, in D13, what is the gross revenue for selling one Jacket? Copy and paste your formula for the remainder of column D. 3. Graph: Select the data table you have created in cells C12D2. Create a line graph for this data. Where the cost and gross revenue lines cross is the break-even point, Choose the correct graph. 3 rtu checr Mo. pori uso s roma ning 3. Graph: Select the data table you have created in colts C12-D42. Create a line graph for this data. Where the cost and grosu revenue linas cross is the break-even point. Choose the correct graph. act the data table you have created in celli C12-D42. Create a line graph for this data. Where the cost and aross revenue lines cross is ven point. Choose the corroct oraph. C. D. 53,500 Break-Even Point 4. Use your spreadsheet to explore how costs and volume interact. What happens to the break-even point if you lower the fixed costs? The break-even point will What happens to the break-even point if you increase your sales price? The break-even point will What happens to the break-even point if you lower the variable costs? The break-even point will 5. Calculate profits in column E. For example, in E13, what is the profit for producing one Jacket? Use a minus sign to enter loss, if any. 6. Using the graph, explain how a break-even point changes in relation to cost and sell price. The inpet in the box below will not be graded, but may be reviewed and considered by your instructor
Step by Step Solution
There are 3 Steps involved in it

Get step-by-step solutions from verified subject matter experts