

Question: Use the data below to calculate the labor efficiency variance assuming the actual and standard labor rate is $20 per hour. Overtime is paid at
Use the data below to calculate the labor efficiency variance assuming the actual and standard labor rate is $20 per hour. Overtime is paid at 1.5 times the standard rate and no overtime nor idle time was budgeted when the production standards were created.
01 date : Date in MM-DD-YYYY 02 day : Day of the Week 03 quarter : A portion of the month. A month was divided into four quarters 04 department : Associated department with the instance 05 team_no : Associated team number with the instance 06 no_of_workers : Number of workers in each team 07 no_of_style_change : Number of changes in the style of a particular product during a shift 08 targeted_productivity : Targeted productivity based on history for each team for each day. Targeted productivity is a % of standard and ideally should be 100% (or 1.00). Use this column to compare with actual_productivity, but you won't need to use it in a variance formula. 09 smv : Standard Minute Value, it is the allocated time for one person to complete one unit in the related department. 10 Actual Production: # of units completed by the department 11 over_time : Represents the amount of overtime by each team in minutes. Overtime pay was budgeted to be zero and employees are paid 1.5x the normal rate for overtime. 12 incentive : Represents the amount of financial incentive (in BDT) that enables or motivates a particular course of action. Ignore this column. 13 idle_time : The amount of time when the production was interrupted due to several reasons 14 idle_men : The number of workers who were idle due to production interruption
15 no_of_style_change: Represents how many times the production line was stopped to change styles, such as moving from sewing or finishing a t-shirt, to setting everything up top sew or finish a sweatshirt.
16 no_of_workers: The number of workers in that department, on that particular shift 15 actual_productivity : The actual % of productivity that was delivered by the workers. It ranges from 0-1.
What are the formulas I would use for this?
Thank you.
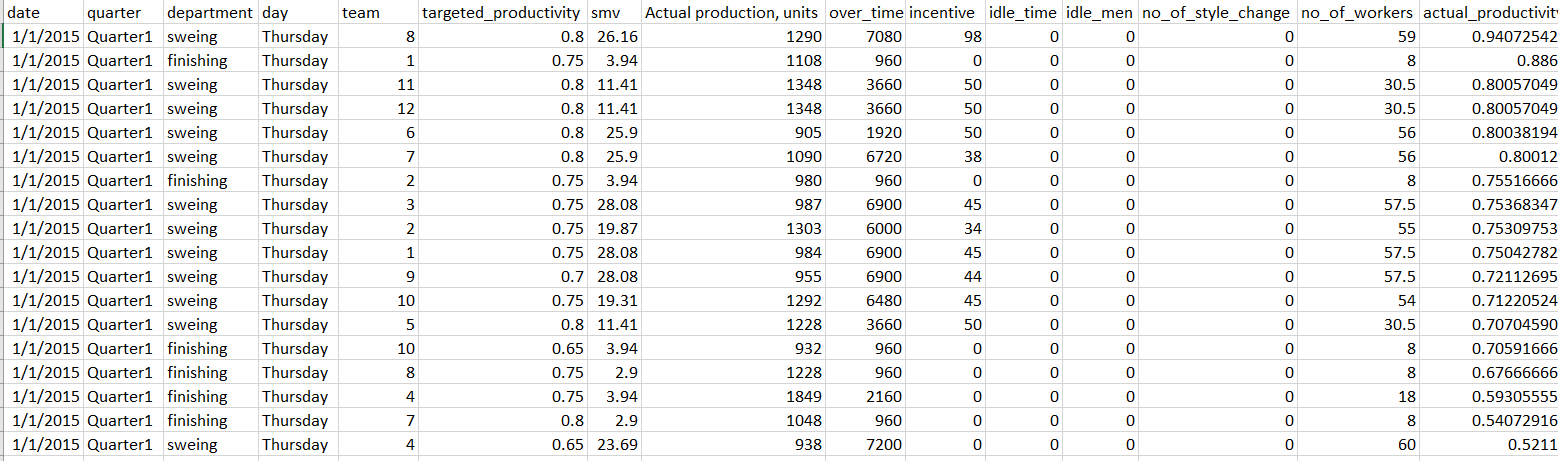
1 date quarter department day team 1/1/2015 Quarter1 sweing Thursday 1/1/2015 Quarter finishing Thursday 1/1/2015 Quarter1 sweing Thursday 1/1/2015 Quarter1 sweing Thursday 1/1/2015 Quarter1 sweing Thursday 1/1/2015 Quarter1 sweing Thursday 1/1/2015 Quarter1 finishing Thursday 1/1/2015 Quarter1 sweing Thursday 1/1/2015 Quarter1 sweing Thursday 1/1/2015 Quarter1 sweing Thursday 1/1/2015 Quarter1 sweing Thursday 1/1/2015 Quarter1 sweing Thursday 1/1/2015 Quarter1 sweing Thursday 1/1/2015 Quarter1 finishing Thursday 1/1/2015 Quarter1 finishing Thursday 1/1/2015 Quarter1 finishing Thursday 1/1/2015 Quarter1 finishing Thursday 1/1/2015 Quarter1 sweing Thursday targeted_productivity smv Actual production, units over_time incentive idle_time idle_men no_of_style_change no_of_workers actual_productivit 8 0.8 26.16 1290 7080 98 0 59 0.94072542 1 0.75 3.94 1108 960 0 0 8 0.886 11 0.8 11.41 1348 3660 50 0 30.5 0.80057049 12 0.8 11.41 1348 3660 50 0 30.5 0.80057049 6 0.8 25.9 905 1920 50 0 56 0.80038194 7 0.8 25.9 1090 6720 38 0 56 0.80012 2 0.75 3.94 980 960 0 0 8 0.75516666 3 0.75 28.08 987 6900 45 0 57.5 0.75368347 2 0.75 19.87 1303 6000 34 0 55 0.75309753 1 0.75 28.08 984 6900 45 0 57.5 0.75042782 9 0.7 28.08 955 6900 44 0 57.5 0.72112695 10 0.75 19.31 1292 6480 45 0 54 0.71220524 5 0.8 11.41 1228 3660 50 0 30.5 0.70704590 10 0.65 3.94 932 960 0 0 8 0.70591666 8 0.75 2.9 1228 960 0 0 8 0.67666666 4 0.75 3.94 1849 2160 0 0 18 0.59305555 7 0.8 2.9 1048 960 0 0 8 0.54072916 4 0.65 23.69 938 7200 0 0 60 0.5211 1 date quarter department day team 1/1/2015 Quarter1 sweing Thursday 1/1/2015 Quarter finishing Thursday 1/1/2015 Quarter1 sweing Thursday 1/1/2015 Quarter1 sweing Thursday 1/1/2015 Quarter1 sweing Thursday 1/1/2015 Quarter1 sweing Thursday 1/1/2015 Quarter1 finishing Thursday 1/1/2015 Quarter1 sweing Thursday 1/1/2015 Quarter1 sweing Thursday 1/1/2015 Quarter1 sweing Thursday 1/1/2015 Quarter1 sweing Thursday 1/1/2015 Quarter1 sweing Thursday 1/1/2015 Quarter1 sweing Thursday 1/1/2015 Quarter1 finishing Thursday 1/1/2015 Quarter1 finishing Thursday 1/1/2015 Quarter1 finishing Thursday 1/1/2015 Quarter1 finishing Thursday 1/1/2015 Quarter1 sweing Thursday targeted_productivity smv Actual production, units over_time incentive idle_time idle_men no_of_style_change no_of_workers actual_productivit 8 0.8 26.16 1290 7080 98 0 59 0.94072542 1 0.75 3.94 1108 960 0 0 8 0.886 11 0.8 11.41 1348 3660 50 0 30.5 0.80057049 12 0.8 11.41 1348 3660 50 0 30.5 0.80057049 6 0.8 25.9 905 1920 50 0 56 0.80038194 7 0.8 25.9 1090 6720 38 0 56 0.80012 2 0.75 3.94 980 960 0 0 8 0.75516666 3 0.75 28.08 987 6900 45 0 57.5 0.75368347 2 0.75 19.87 1303 6000 34 0 55 0.75309753 1 0.75 28.08 984 6900 45 0 57.5 0.75042782 9 0.7 28.08 955 6900 44 0 57.5 0.72112695 10 0.75 19.31 1292 6480 45 0 54 0.71220524 5 0.8 11.41 1228 3660 50 0 30.5 0.70704590 10 0.65 3.94 932 960 0 0 8 0.70591666 8 0.75 2.9 1228 960 0 0 8 0.67666666 4 0.75 3.94 1849 2160 0 0 18 0.59305555 7 0.8 2.9 1048 960 0 0 8 0.54072916 4 0.65 23.69 938 7200 0 0 60 0.5211
Step by Step Solution
There are 3 Steps involved in it

Get step-by-step solutions from verified subject matter experts