

Question: Use the data for the United States in this table to answer the following questions Year 2016 2017 2018 2019 2020 Real GDP Per Capita

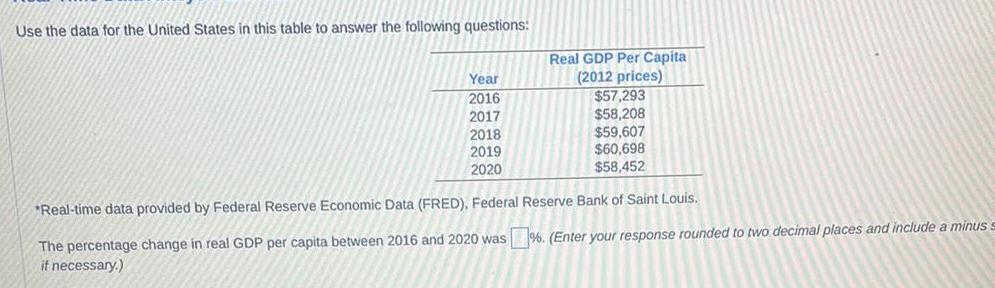
Use the data for the United States in this table to answer the following questions Year 2016 2017 2018 2019 2020 Real GDP Per Capita 2012 prices 57 293 58 208 59 607 60 698 58 452 Real time data provided by Federal Reserve Economic Data FRED Federal Reserve Bank of Saint Louis The percentage change in real GDP per capita between 2016 and 2020 was Enter your response rounded to two decimal places and include a minus s if necessary
Step by Step Solution
There are 3 Steps involved in it
1 Expert Approved Answer
Step: 1 Unlock

Question Has Been Solved by an Expert!
Get step-by-step solutions from verified subject matter experts
Step: 2 Unlock
Step: 3 Unlock