

Question: Use the data in the attached Excel file. Do the following: 1. Calculate the seasonal relatives for each quarter. 2. Using the seasonal relatives, deseasonalize
Use the data in the attached Excel file. Do the following:
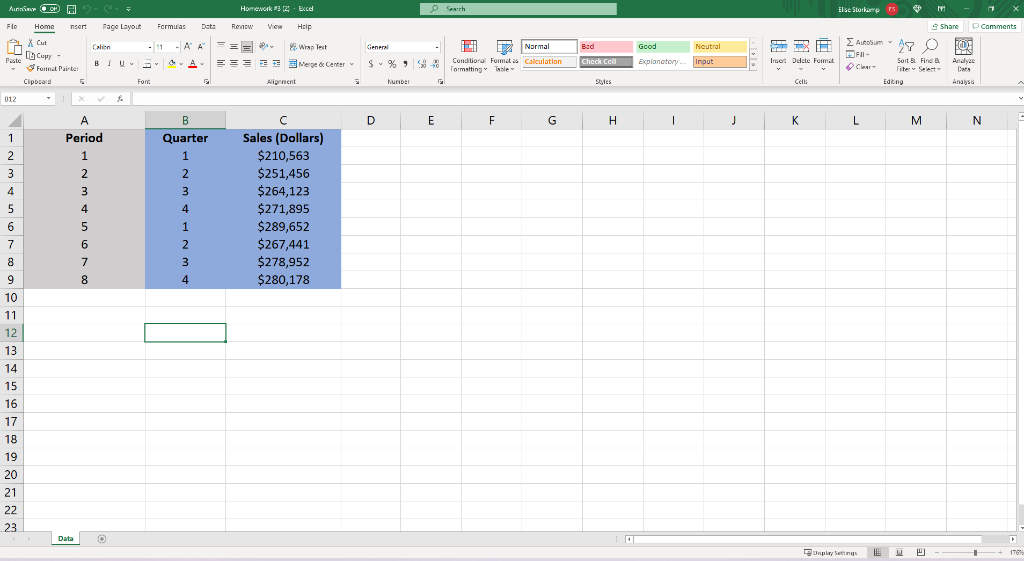
1. Calculate the seasonal relatives for each quarter.
2. Using the seasonal relatives, deseasonalize the sales data.
3. Find a linear trend forecast for the deseasonalized data. Forecast for periods 1-8 as well as 9 and 10.
4. Adjust the linear tend forecast (using the seasonalize relatives) to get the final forecasted data. Do this for the historical data (periods 1-8) as well as period 9 and 10.
5. Finally, calculate MAPE. Comment on the likely accuracy of the forecast.
Step by Step Solution
There are 3 Steps involved in it
1 Expert Approved Answer
Step: 1 Unlock

Question Has Been Solved by an Expert!
Get step-by-step solutions from verified subject matter experts
Step: 2 Unlock
Step: 3 Unlock