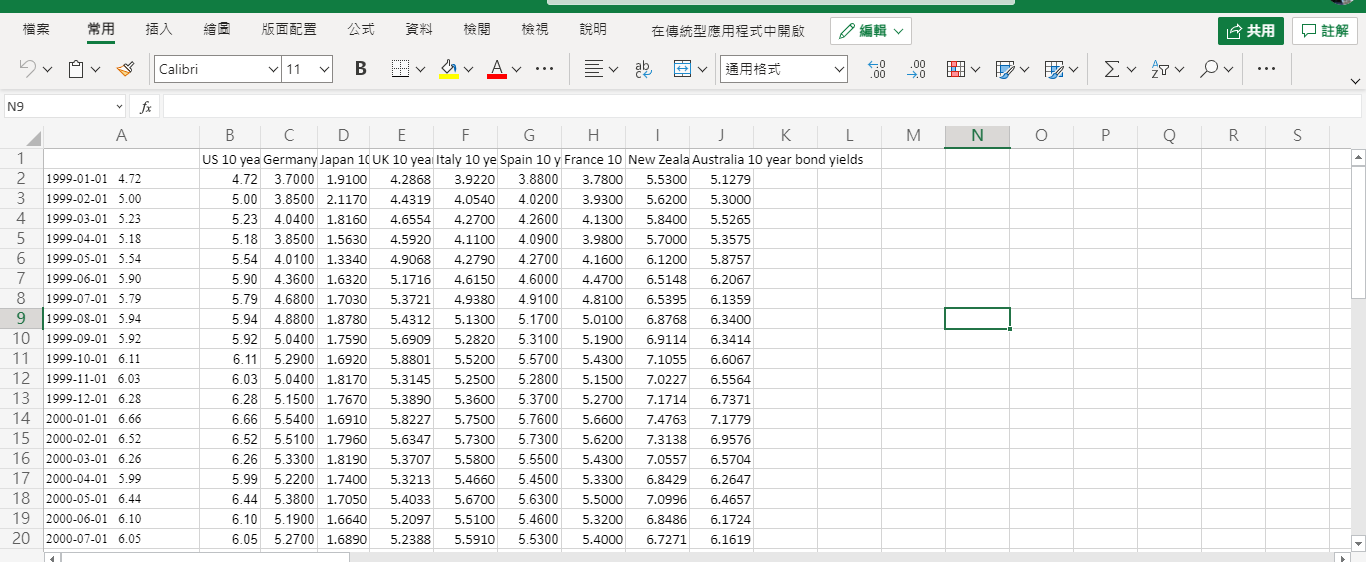
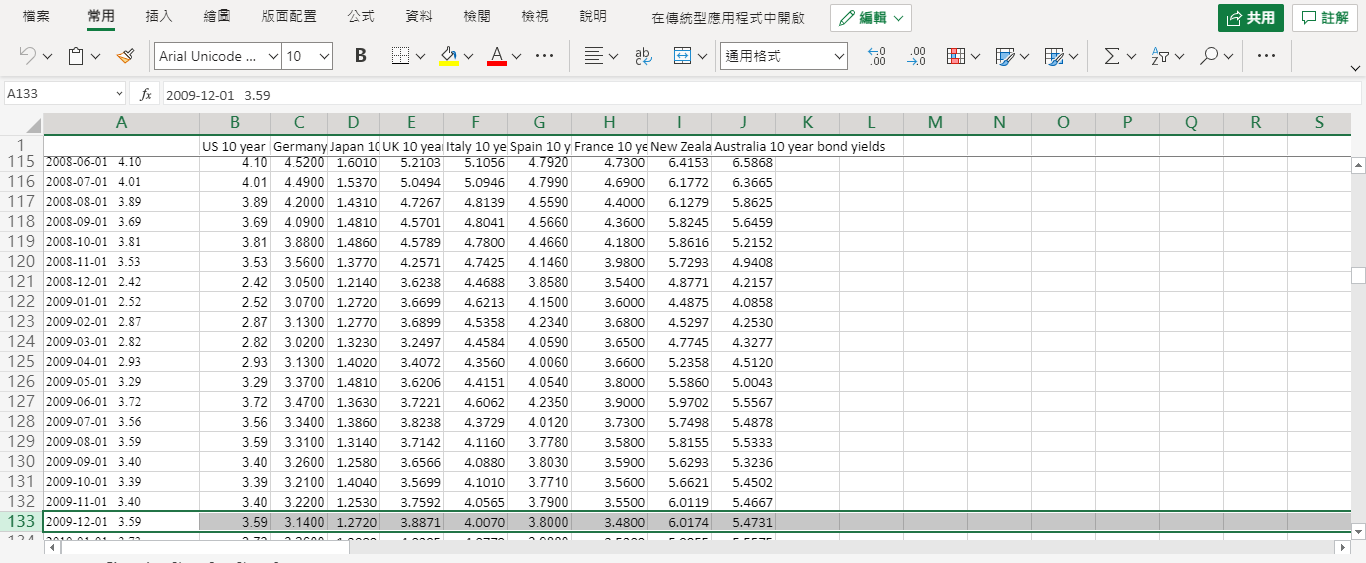
Question: Use the data in the file: 10-year bond.xlsto construct a table of the correlation amongst each pair of all 10-year bond yield, described your results
- Use the data in the file: 10-year bond.xlsto construct a table of the correlation amongst each pair of all 10-year bond yield, described your results and investigates why some countries yields are very high correlated.
Should I calculate CORRELATION for all the countries provided in the file? and make a table/chart to explain why some countries are high corelated?
- Given the objective of the firm to diversify from Japanese risk, recommend a portfolio investment for the next 10 years.
- Domestic and international economic context (e.g.interest rates, exchange rates economic growth and inflation)
- Diversification
- Risk/return
- Liquidity
Below is some ideas, but I am not too sure I am on the right track.
Also, I'm not sure I used the right yields. I chose 2009 is because it started from 1999
Total amount of investment in Government bonds = 100milllion
Diversification of investment into four countries after considering the 4 types of risks keeping in mind the economy of Japan
Investment Percentages
Countries YTM% of investment
UK 10 year 3.8810 Million
New Zealand 10 year 6.01 30 Million
Austrlia 10 year 5.47 30 Million
Italy10year 4.00 30 Million
Calibri v 11 B A . . . Ev ab .00 . . . 00 N9 fx A B C D E F G H K L M N O P Q R S US 10 yea Germany Japan 10UK 10 yearItaly 10 ye Spain 10 y France 10 New Zealaustralia 10 year bond yields 1999-01-01 4.72 4.72 3.7000 1.9100 4.2868 3.9220 3.8800 3.7800 5.5300 5.1279 1999-02-01 5.00 5.00 3.8500 2.1170 4.4319 4.0540 4.0200 3.9300 5.6200 5.3000 1999-03-01 5.23 5.23 4.0400 1.8160 4.6554 4.2700 4.2600 4.1300 5.8400 5.5265 1999-04-01 5.18 5.18 3.8500 1.5630 4.5920 4.1100 4.0900 3.9800 5.7000 5.3575 1999-05-01 5.54 5.54 4.0100 1.3340 4.9068 4.2790 4.2700 4.1600 6.1200 5.8757 1999-06-01 5.90 5.90 4.3600 1.6320 5.1716 4.6150 4.6000 4.4700 6.5148 6.2067 8 1999-07-01 5.79 5.79 4.6800 1.7030 5.3721 4.9380 4.9100 4.8100 6.5395 6.1359 9 1999-08-01 5.94 5.94 4.8800 1.8780 5.4312 5.1300 5.1700 5.0100 6.8768 6.3400 10 1999-09-01 5.92 5.92 5.0400 1.7590 5.6909 5.2820 5.3100 5.1900 6.9114 6.3414 11 1999-10-01 6.11 6.11 5.2900 1.6920 5.8801 5.5200 5.5700 5.4300 7.1055 6.6067 12 1999-11-01 6.03 6.03 5.0400 1.8170 5.3145 5.2500 5.2800 5.1500 7.0227 6.5564 13 1999-12-01 6.28 6.28 5.1500 1.7670 5.3890 5.3600 5.3700 5.2700 7.1714 6.7371 14 2000-01-01 6.66 6.66 5.5400 1.6910 5.8227 5.7500 5.7600 5.6600 7.4763 7.1779 15 2000-02-01 6.52 6.52 5.5100 1.7960 5.6347 5.7300 5.7300 5.6200 7.3138 6.9576 16 2000-03-01 6.26 6.26 5.3300 1.8190 5.3707 5.5800 5.5500 5.4300 7.0557 6.5704 17 2000-04-01 5.99 5.99 5.2200 1.7400 5.3213 5.4660 5.4500 5.3300 6.8429 6.2647 18 2000-05-01 6.44 6.44 5.3800 1.7050 5.4033 5.6700 5.6300 5.5000 7.0996 6.4657 19 2000-06-01 6.10 6.10 5.1900 1.6640 5.2097 5.5100 5.4600 5.3200 6.8486 6.1724 20 2000-07-01 6.05 6.05 5.2700 1.6890 5.2388 5.5910 5.5300 5.4000 6.7271 6.1619. . . .00 Arial Unicode ... v 10 B Av Ev ab . . . A133 fx 2009-12-01 3.59 A B C D E F G H K L M N O P Q R S US 10 year Germany Japan 10 UK 10 yea Italy 10 ye Spain 10 y France 10 ye New Zealaustralia 10 year bond yields 115 2008-06-01 4.10 4.10 4.5200 1.6010 5.2103 5.1056 4.7920 4.7300 6.4153 6.5868 116 2008-07-01 4.01 4.01 4.4900 1.5370 5.0494 5.0946 4.7990 4.6900 6.1772 6.3665 117 2008-08-01 3.89 3.89 4.2000 1.4310 4.7267 4.8139 4.5590 4.4000 6.1279 5.8625 118 2008-09-01 3.69 3.69 4.0900 1.4810 4.5701 4.8041 4.5660 4.3600 5.8245 5.6459 119 2008-10-01 3.81 3.81 3.8800 1.4860 4.5789 4.7800 4.4660 4.1800 5.8616 5.2152 120 2008-11-01 3.53 3.53 3.5600 1.3770 4.2571 4.7425 4.1460 3.9800 5.7293 4.9408 121 2008-12-01 2.42 2.42 3.0500 1.2140 3.6238 4.4688 3.8580 3.5400 4.8771 4.2157 122 2009-01-01 2.52 2.52 3.0700 1.2720 3.6699 4.6213 4.1500 3.6000 4.4875 4.0858 123 2009-02-01 2.87 2.87 3.1300 1.2770 3.6899 4.5358 4.2340 3.6800 4.5297 4.2530 124 2009-03-01 2.82 2.82 3.0200 1.3230 3.2497 4.4584 4.0590 3.6500 4.7745 4.3277 125 2009-04-01 2.93 2.93 3.1300 1.4020 3.4072 4.3560 4.0060 3.6600 5.2358 4.5120 126 2009-05-01 3.29 3.29 3.3700 1.4810 3.6206 4.4151 4.0540 3.8000 5.5860 5.0043 127 2009-06-01 3.72 3.72 3.4700 1.3630 3.7221 4.6062 4.2350 3.9000 5.9702 5.5567 128 2009-07-01 3.56 3.56 3.3400 1.3860 3.8238 4.3729 4.0120 3.7300 5.7498 5.4878 129 2009-08-01 3.59 3.59 3.3100 1.3140 3.7142 4.1160 3.7780 3.5800 5.8155 5.5333 130 2009-09-01 3.40 3.40 3.2600 1.2580 3.6566 4.0880 3.8030 3.5900 5.6293 5.3236 131 2009-10-01 3.39 3.39 3.2100 1.4040 3.5699 4.1010 3.7710 3.5600 5.6621 5.4502 132 2009-11-01 3.40 3.40 3.2200 1.2530 3.7592 4.0565 3.7900 3.5500 6.0119 5.4667 133 2009-12-01 3.59 3.59 3.1400 1.2720 3.8871 4.0070 3.8000 3.4800 6.0174 5.4731