

Question: Use the data in the given table to create a scatter-plot. Use the scatter-plot to choose the most appropriate regression model, then fill in the
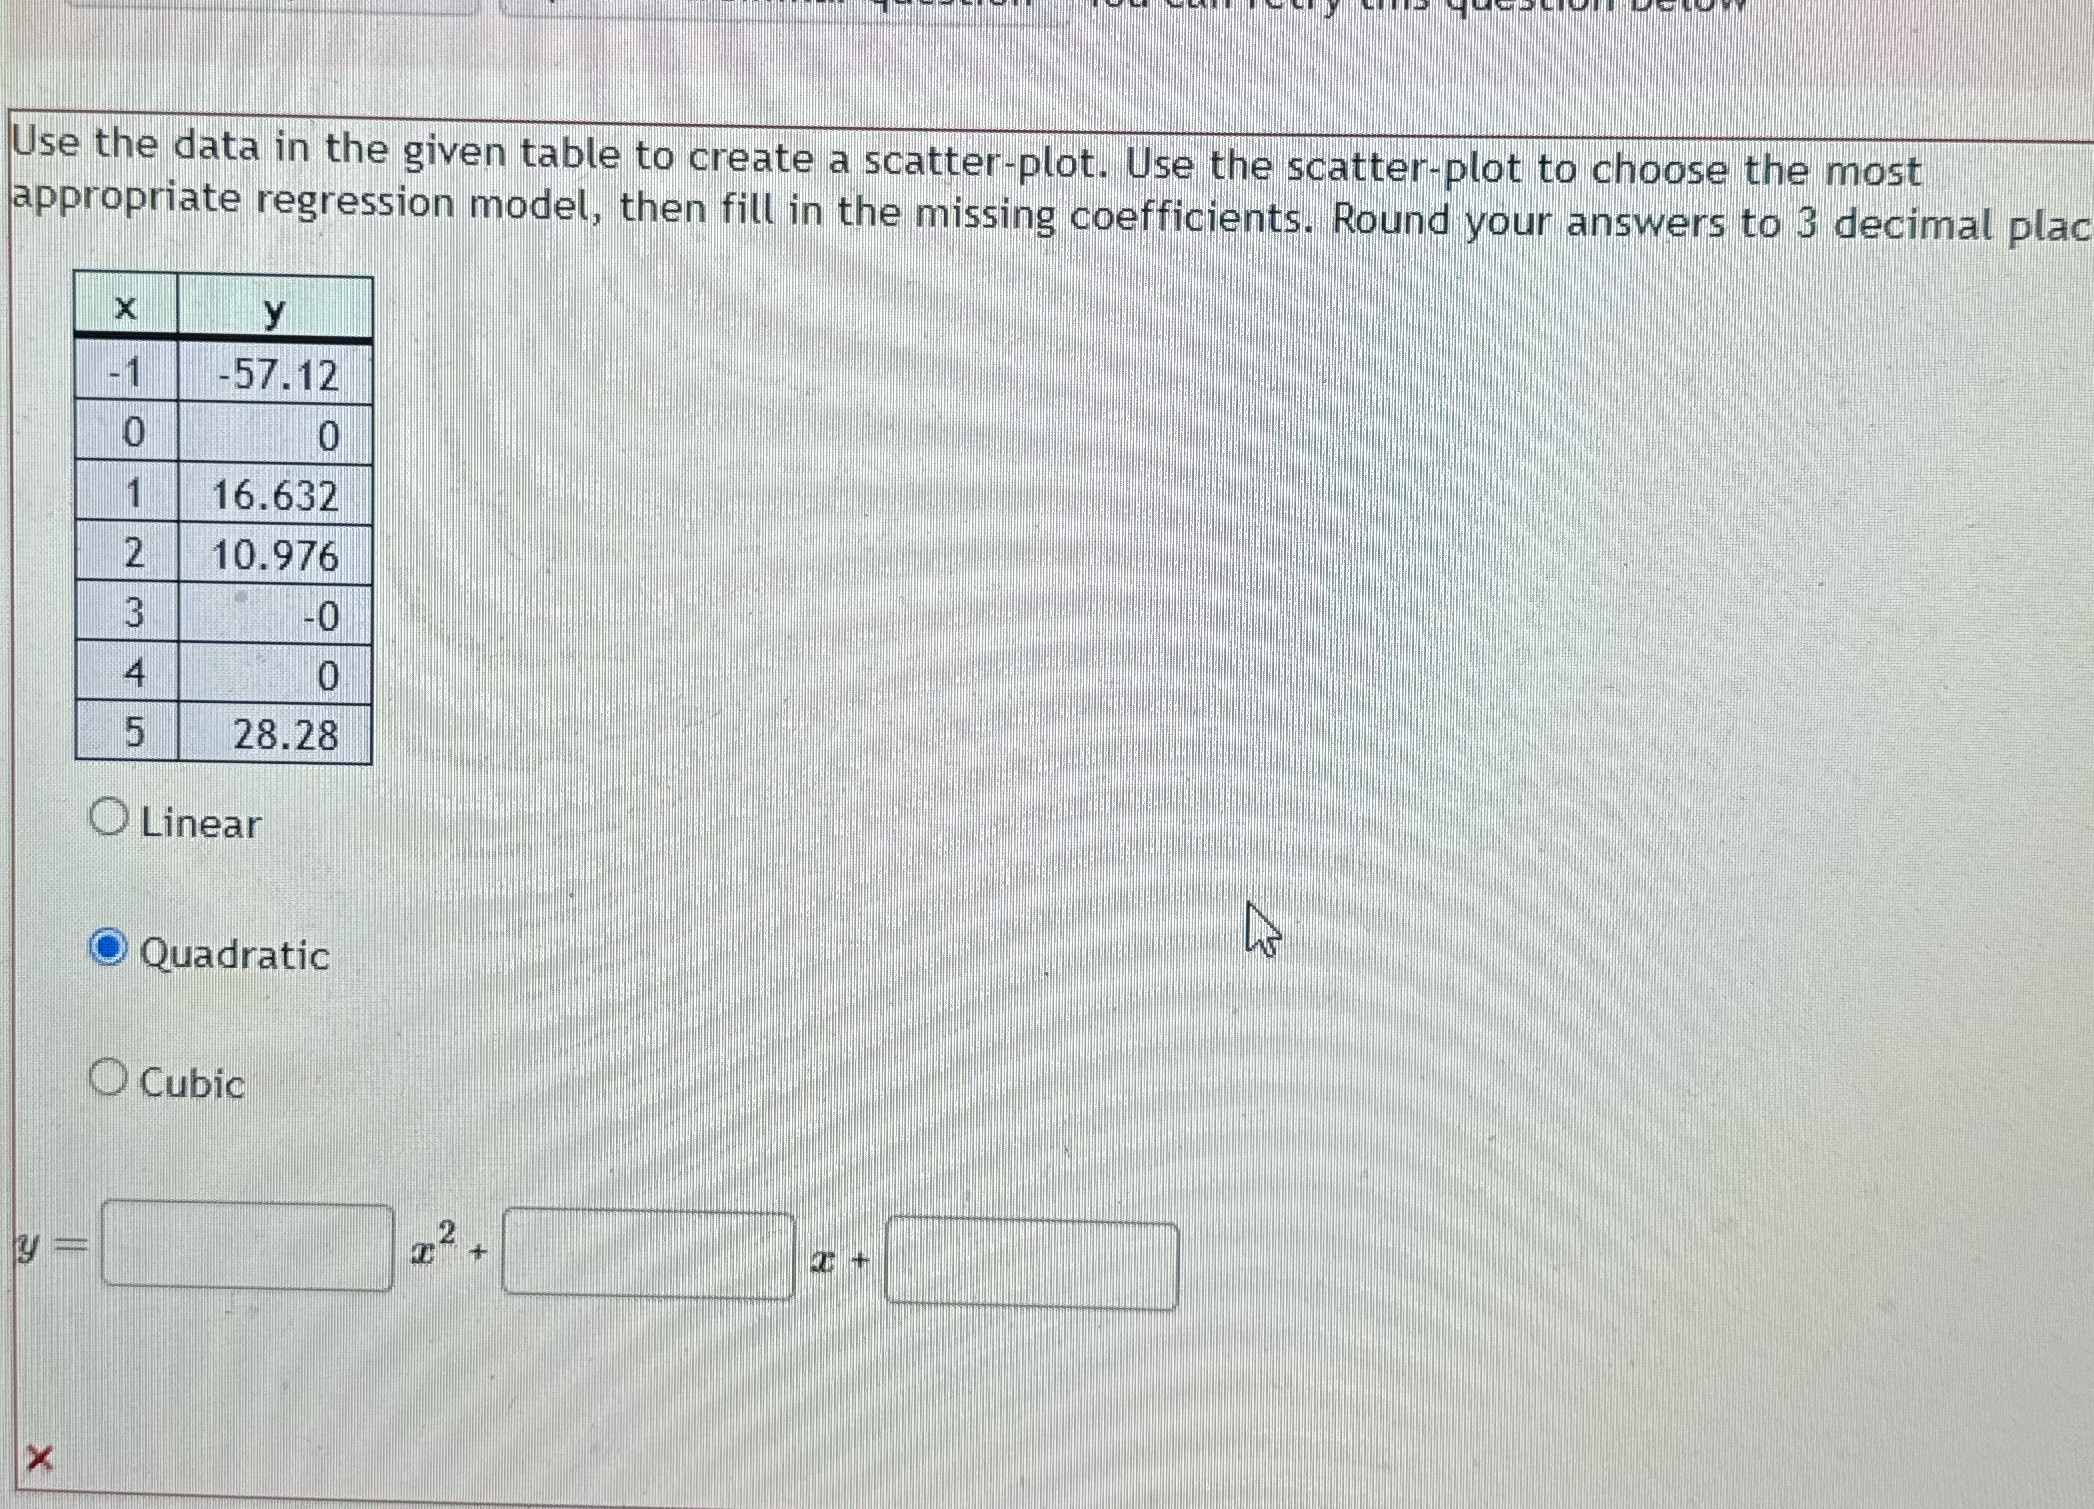
Use the data in the given table to create a scatter-plot. Use the scatter-plot to choose the most appropriate regression model, then fill in the missing coefficients. Round your answers to 3 decimal plac X y -57. 12 0 0 1 16.632 2 10.976 3 -0 4 O 5 28.28 O Linear O Quadratic Cubic y X
Step by Step Solution
There are 3 Steps involved in it
1 Expert Approved Answer
Step: 1 Unlock

Question Has Been Solved by an Expert!
Get step-by-step solutions from verified subject matter experts
Step: 2 Unlock
Step: 3 Unlock