

Question: Use the data in the sheet titled Raw data to calculate the profit for each product category and product sub category ( ability to drill
Use the data in the sheet titled "Raw data" to calculate the profit for each product
category and product sub category ability to drill down points: points each
a Create a new worksheet titled Q Profit by Category" and insert a new
pivot table for the data in the sheet "Raw Data". Move the worksheet to
the position.
b List the total profit for product categories and subcategories in this table
c Format the numbers to reflect the $ symbol before the figures and
decimal places.
d Change the column headings to be meaningful.
e Add a meaningful title to the worksheet at the top and center it across the
pivot table.
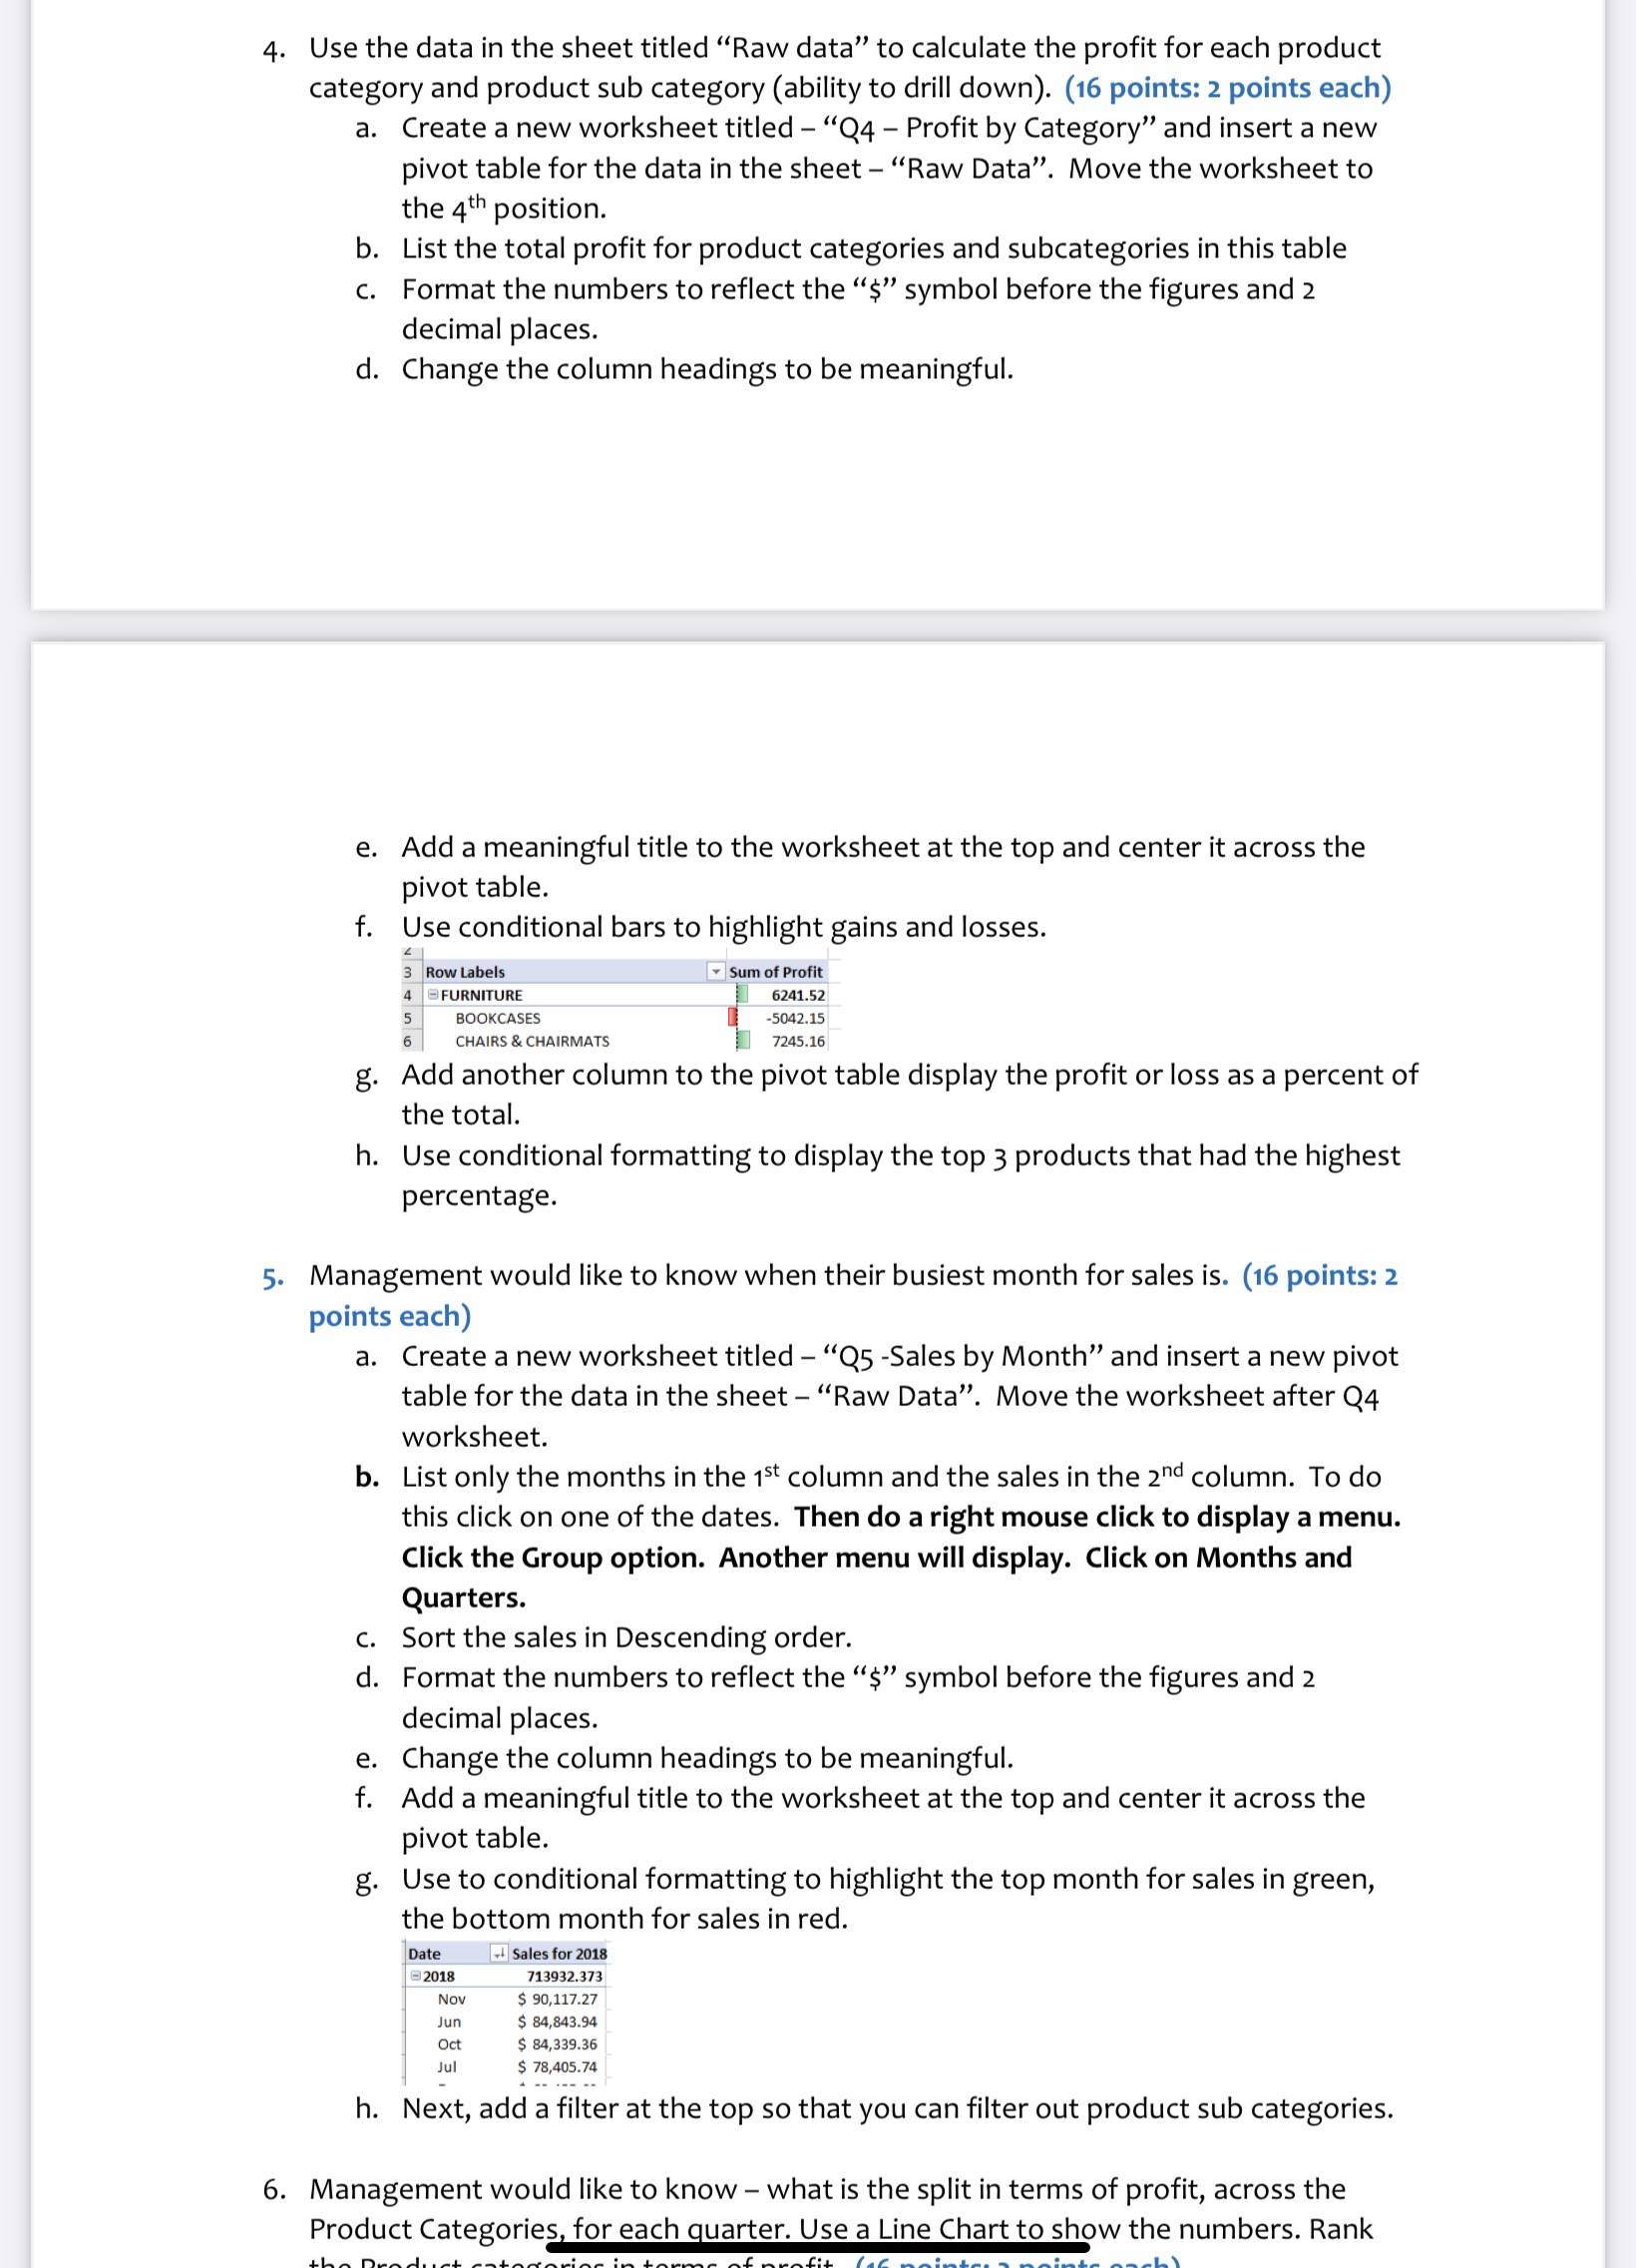
f Use conditional bars to highlight gains and losses.
g Add another column to the pivot table display the profit or loss as a percent of
the total.
h Use conditional formatting to display the top products that had the highest
percentage.
Management would like to know when their busiest month for sales is points:
points each
a Create a new worksheet titled QSales by Month" and insert a new pivot
table for the data in the sheet "Raw Data". Move the worksheet after Q
worksheet.
b List only the months in the column and the sales in the column. To do
this click on one of the dates. Then do a right mouse click to display a menu.
Click the Group option. Another menu will display. Click on Months and
Quarters.
c Sort the sales in Descending order.
d Format the numbers to reflect the $ symbol before the figures and
decimal places.
e Change the column headings to be meaningful.
f Add a meaningful title to the worksheet at the top and center it across the
pivot table.
g Use to conditional formatting to highlight the top month for sales in green,
the bottom month for sales in red.
h Next, add a filter at the top so that you can filter out product sub categories.
Management would like to know what is the split in terms of profit, across the
Product Categories, for each quarter. Use a Line Chart to show the numbers. Rank
Step by Step Solution
There are 3 Steps involved in it
1 Expert Approved Answer
Step: 1 Unlock

Question Has Been Solved by an Expert!
Get step-by-step solutions from verified subject matter experts
Step: 2 Unlock
Step: 3 Unlock