

Question: Use the data in the table and the graph below to answer the questions. Class 1 Test Score Analysis Class 1 Mean Study Mean Test
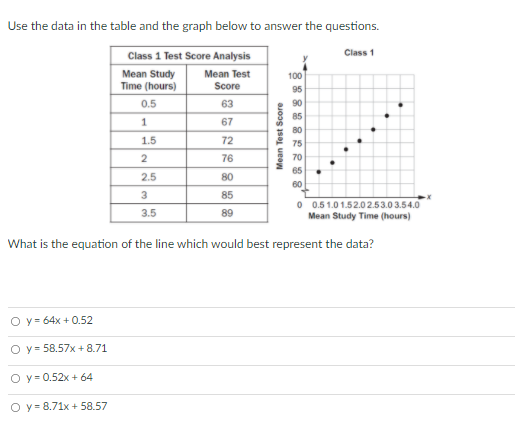
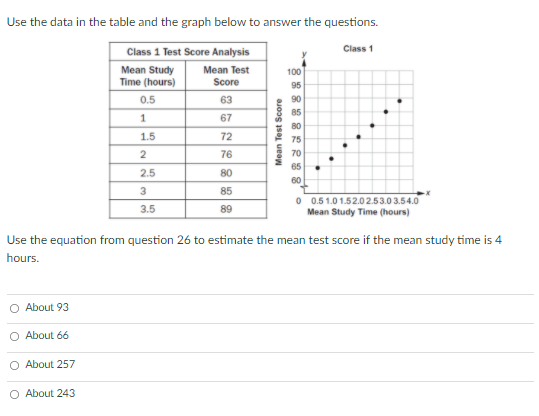
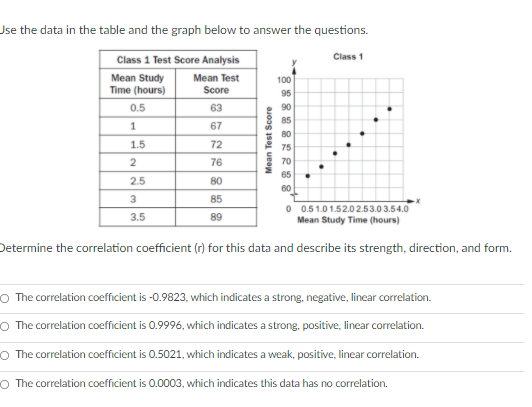
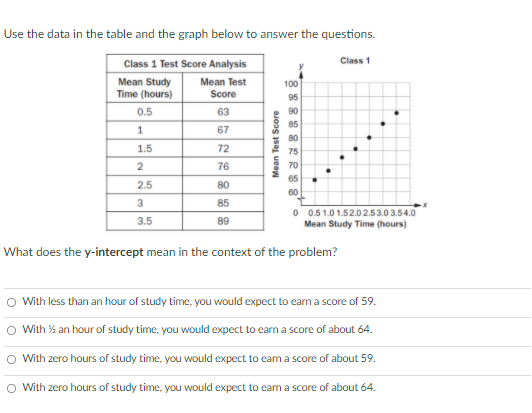
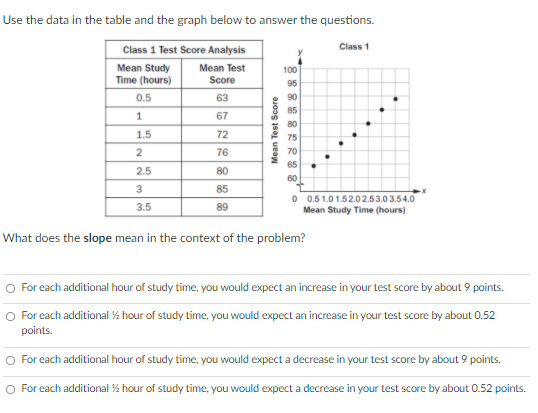
Use the data in the table and the graph below to answer the questions. Class 1 Test Score Analysis Class 1 Mean Study Mean Test 100 Time (hours) Score 95 0.5 63 90 1 67 85 80 Mean Test Score 1.5 72 75 2 76 70 65 2.5 80 60 3 85 0 0.51.01.52.02.53.03.54.0 3.5 89 Mean Study Time (hours) What is the equation of the line which would best represent the data? O y = 64x + 0.52 O y = 58.57x +8.71 O y = 0.52x + 64 O y= 8.71x + 58.57Use the data in the table and the graph below to answer the questions. Class 1 Test Score Analysis Class 1 Mean Study Mean Test 100 Time (hours) Score 95 0.5 63 90 1 67 80 1.5 72 Mean Test Score 75 2 76 70 2.5 80 65 3 85 0 0.5 1.01.52.02.53.03.54.0 3.5 89 Mean Study Time (hours) Use the equation from question 26 to estimate the mean test score if the mean study time is 4 hours. O About 93 O About 66 O About 257 O About 243Ise the data in the table and the graph below to answer the questions. Class 1 Test Score Analysis Class 1 Mean Study Mean Test 100 Time (hours) Score 95 0.5 63 90 1 67 85 80 Mean Test Score 1.5 72 75 2 76 70 65 2.5 80 3 85 0 0.5 1.0 1.52.02.53.03.54.0 3.5 89 Mean Study Time (hours) Determine the correlation coefficient (r) for this data and describe its strength, direction, and form. O The correlation coefficient is -0.9823, which indicates a strong, negative, linear correlation. O The correlation coefficient is 0.9996, which indicates a strong, positive, linear correlation. O The correlation coefficient is 0.5021, which indicates a weak, positive, linear correlation. O The correlation coefficient is 0.0003, which indicates this data has no correlation.Use the data in the table and the graph below to answer the questions. Class 1 Test Score Analysis Class 1 Mean Study Mean Test 100 Time (hours) Score 95 0.5 63 90 67 85 1 1.5 72 Mean Test Score 75 2 76 70 65 2.5 80 60 3 85 0 0.5 1.01.52.02.53.03.54.0 3.5 89 Mean Study Time (hours) What does the y-intercept mean in the context of the problem? O With less than an hour of study time, you would expect to earn a score of 59. O With % an hour of study time, you would expect to earn a score of about 64. O With zero hours of study time, you would expect to earn a score of about 59. O With zero hours of study time, you would expect to earn a score of about 64.Use the data in the table and the graph below to answer the questions. Class 1 Test Score Analysis Class 1 Mean Study Mean Test 100 Time (hours) Score 95 0.5 63 90 85 1 67 Mean Test Score 1.5 72 75 2 76 70 65 2.5 80 60 3 85 0 0.51.01.52.02.53.03.54.0 3.5 89 Mean Study Time (hours) What does the slope mean in the context of the problem? O For each additional hour of study time, you would expect an increase in your test score by about 9 points. O For each additional %% hour of study time, you would expect an increase in your test score by about 0.52 points. O For each additional hour of study time, you would expect a decrease in your test score by about 9 points. O For each additional %% hour of study time, you would expect a decrease in your test score by about 0.52 points
Step by Step Solution
There are 3 Steps involved in it

Get step-by-step solutions from verified subject matter experts