

Question: Use the data in the table to calculate the expected activity times, d, and then compute the critical path for each event using d as
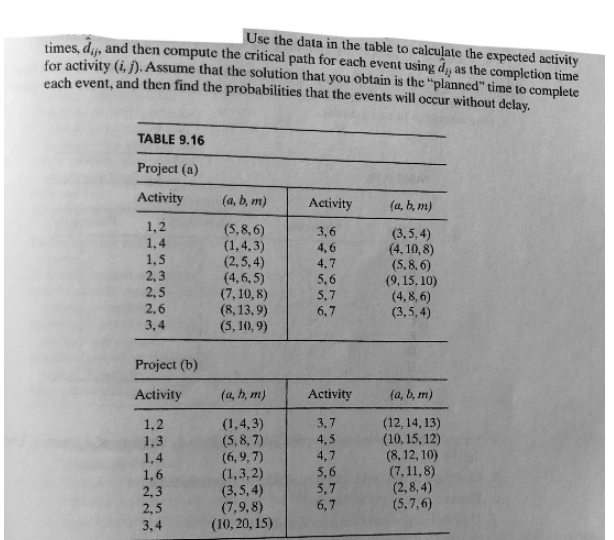
Use the data in the table to calculate the expected activity times, d, and then compute the critical path for each event using d as the completion time for activity (i,j). Assume the solution you obtain is the planned time to complete each event, and then find the probabilities that the events will occur without delay.
Please write out any equations of excel inputs. Very confused on this. Thanks in advance.
Step by Step Solution
There are 3 Steps involved in it
1 Expert Approved Answer
Step: 1 Unlock

Question Has Been Solved by an Expert!
Get step-by-step solutions from verified subject matter experts
Step: 2 Unlock
Step: 3 Unlock