

Question: Use the data in the table to make a line graph. To create the graph, first click on Add Element and select the label Concentration
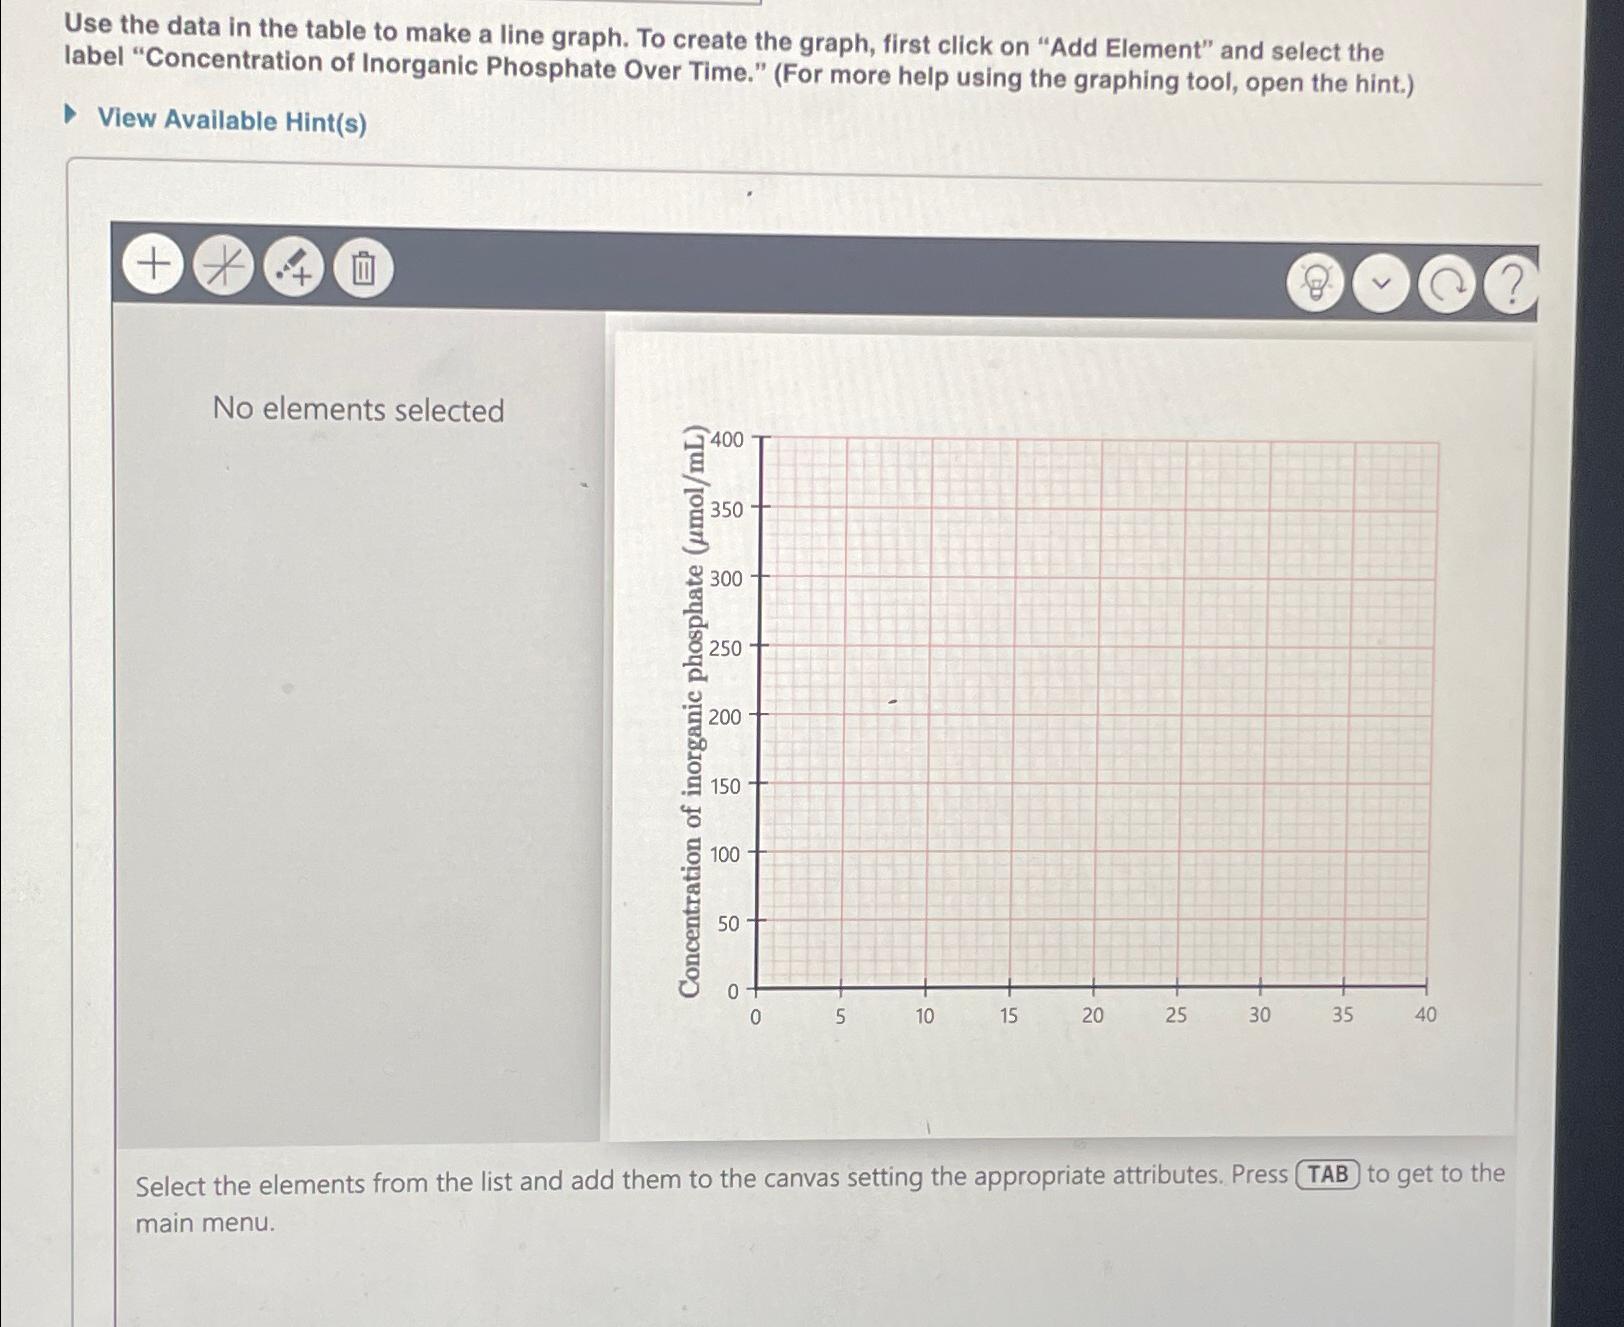
Use the data in the table to make a line graph. To create the graph, first click on "Add Element" and select the label "Concentration of Inorganic Phosphate Over Time." For more help using the graphing tool, open the hint.
View Available Hints
No elements selected
Select the elements from the list and add them to the canvas setting the appropriate attributes. Press to get to the main menu.
Step by Step Solution
There are 3 Steps involved in it
1 Expert Approved Answer
Step: 1 Unlock

Question Has Been Solved by an Expert!
Get step-by-step solutions from verified subject matter experts
Step: 2 Unlock
Step: 3 Unlock