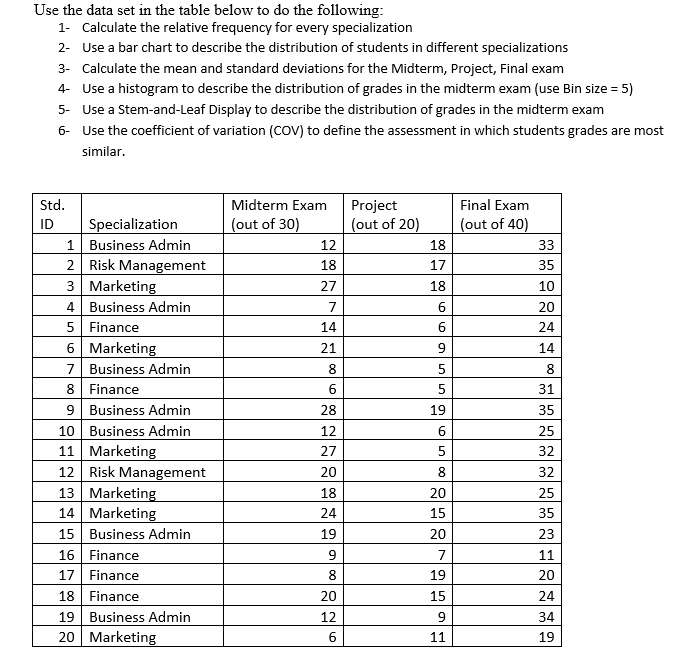
Question: Use the data set in the table below to do the following: 1- Calculate the relative frequency for every specialization 2- Use a bar chart

Use the data set in the table below to do the

Use the data set in the table below to do the following: 1- Calculate the relative frequency for every specialization 2- Use a bar chart to describe the distribution of students in different specializations 3- Calculate the mean and standard deviations for the Midterm, Project, Final exam 4- Use a histogram to describe the distribution of grades in the midterm exam (use Bin size = 5) 5- Use a Stem-and-Leaf Display to describe the distribution of grades in the midterm exam 6- Use the coefficient of variation (COV) to define the assessment in which students grades are most similar. Midterm Exam (out of 30) 12 Project (out of 20) 18 Final Exam (out of 40) 33 35 10 18 17 18 27 7 20 24 6 14 21 14 8 5 8 6 6 Std. ID Specialization 1 Business Admin 2 Risk Management 3 Marketing 4 Business Admin 5 Finance 6 Marketing 7 Business Admin 8 Finance 9 Business Admin 10 Business Admin 11 Marketing 12 Risk Management 13 Marketing 14 Marketing 15 Business Admin 16 Finance 17 Finance 18 Finance 19 Business Admin 20 Marketing ||| ||| [ 00 19 31 35 25 32 5 28 12 27 20 18 24 19 8 32 20 15 20 25 35 23 9 11 7 19 8 20 15 20 24 34 19 12 9 6 11

Step by Step Solution

There are 3 Steps involved in it

1 Expert Approved Answer
Step: 1 Unlock blur-text-image
Question Has Been Solved by an Expert!

Get step-by-step solutions from verified subject matter experts

Step: 2 Unlock
Step: 3 Unlock

Students Have Also Explored These Related General Management Questions!