

Question: Use the data set provide below and do the following. You can use Minitab or any graphing software to do the histogram or any other
Use the data set provide below and do the following. You can use Minitab or any graphing software to do the histogram or any other graph.
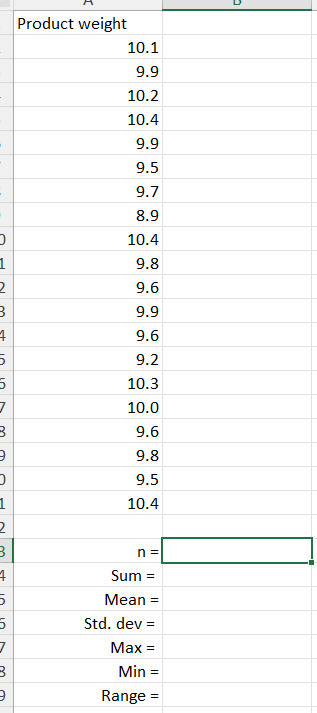
a. Calculate appropriate descriptive statistics of the data set (product weights). b. Create a histogram and assess the normality of the data set. c. What are the raw scores that correspond to +/- 1.96 ?? 1. What proportion of product, total, would be less than - 1.96 ? or greater than + 1.96 ?? d. What is the z score for the minimum product weight in the data set? Please, explain your work and decisions for a better understanding.
\f
Step by Step Solution
There are 3 Steps involved in it
1 Expert Approved Answer
Step: 1 Unlock

Question Has Been Solved by an Expert!
Get step-by-step solutions from verified subject matter experts
Step: 2 Unlock
Step: 3 Unlock