

Question: Use the data shown in the following Table (columns 1 and 2) to demonstrate the use of the method of regression analysis in fitting
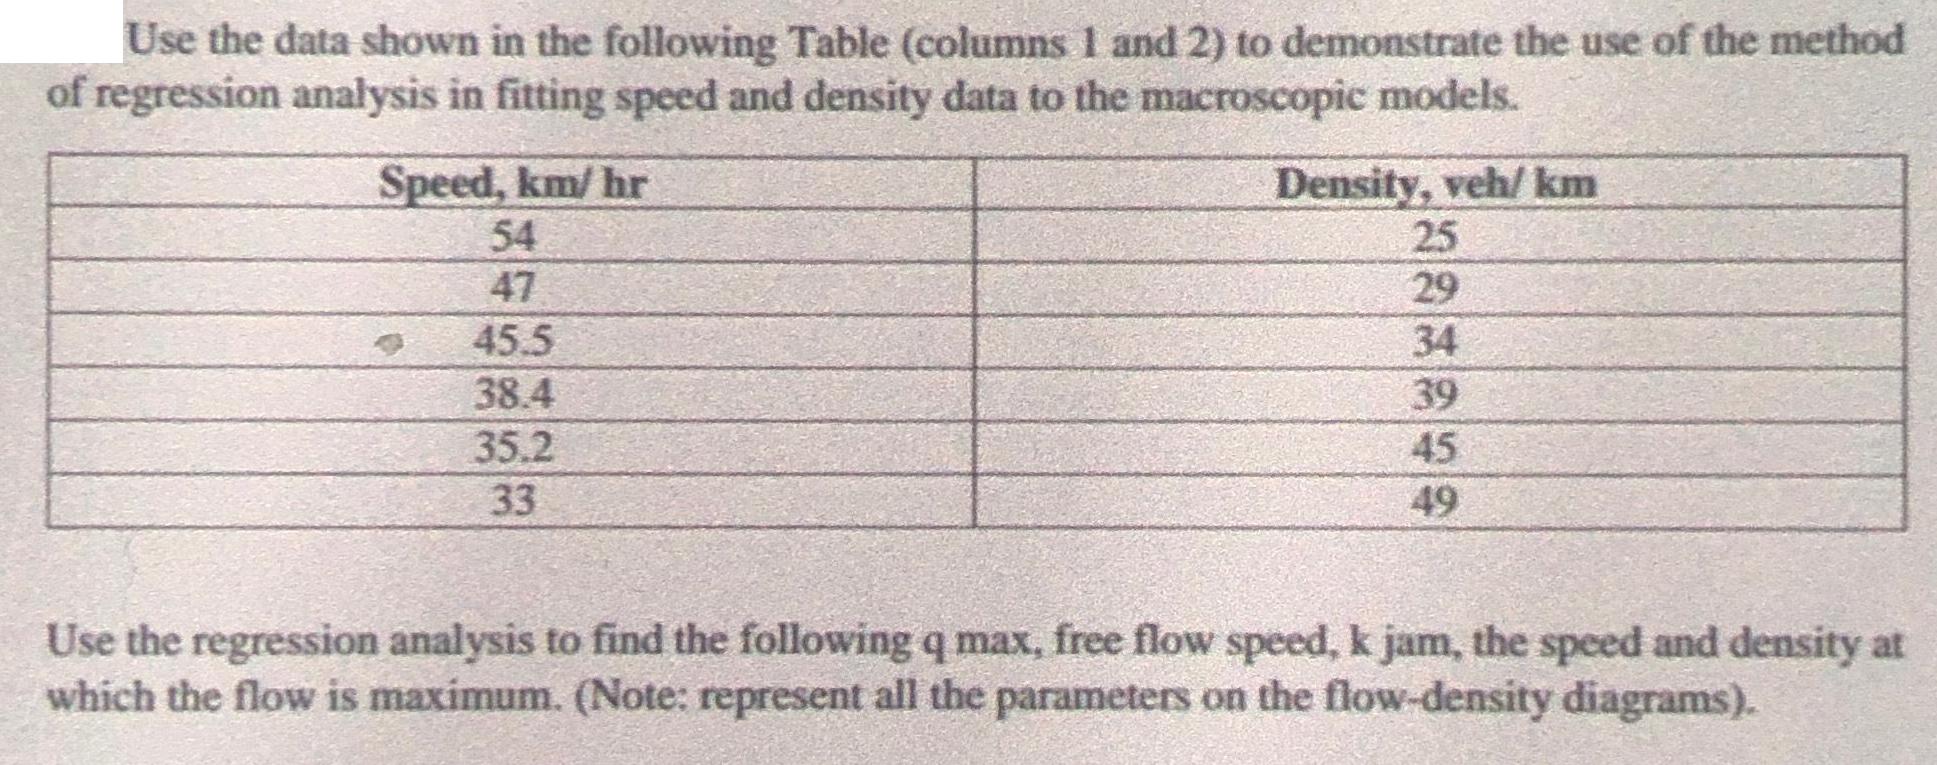
Use the data shown in the following Table (columns 1 and 2) to demonstrate the use of the method of regression analysis in fitting speed and density data to the macroscopic models. Speed, km/ hr 54 47 45.5 38.4 35.2 33 O Density, veh/ km 25 29 34 39 45 49 Use the regression analysis to find the following q max, free flow speed, k jam, the speed and density at which the flow is maximum. (Note: represent all the parameters on the flow-density diagrams).
Step by Step Solution
★★★★★
3.47 Rating (154 Votes )
There are 3 Steps involved in it
1 Expert Approved Answer
Step: 1 Unlock

Question Has Been Solved by an Expert!
Get step-by-step solutions from verified subject matter experts
Step: 2 Unlock
Step: 3 Unlock