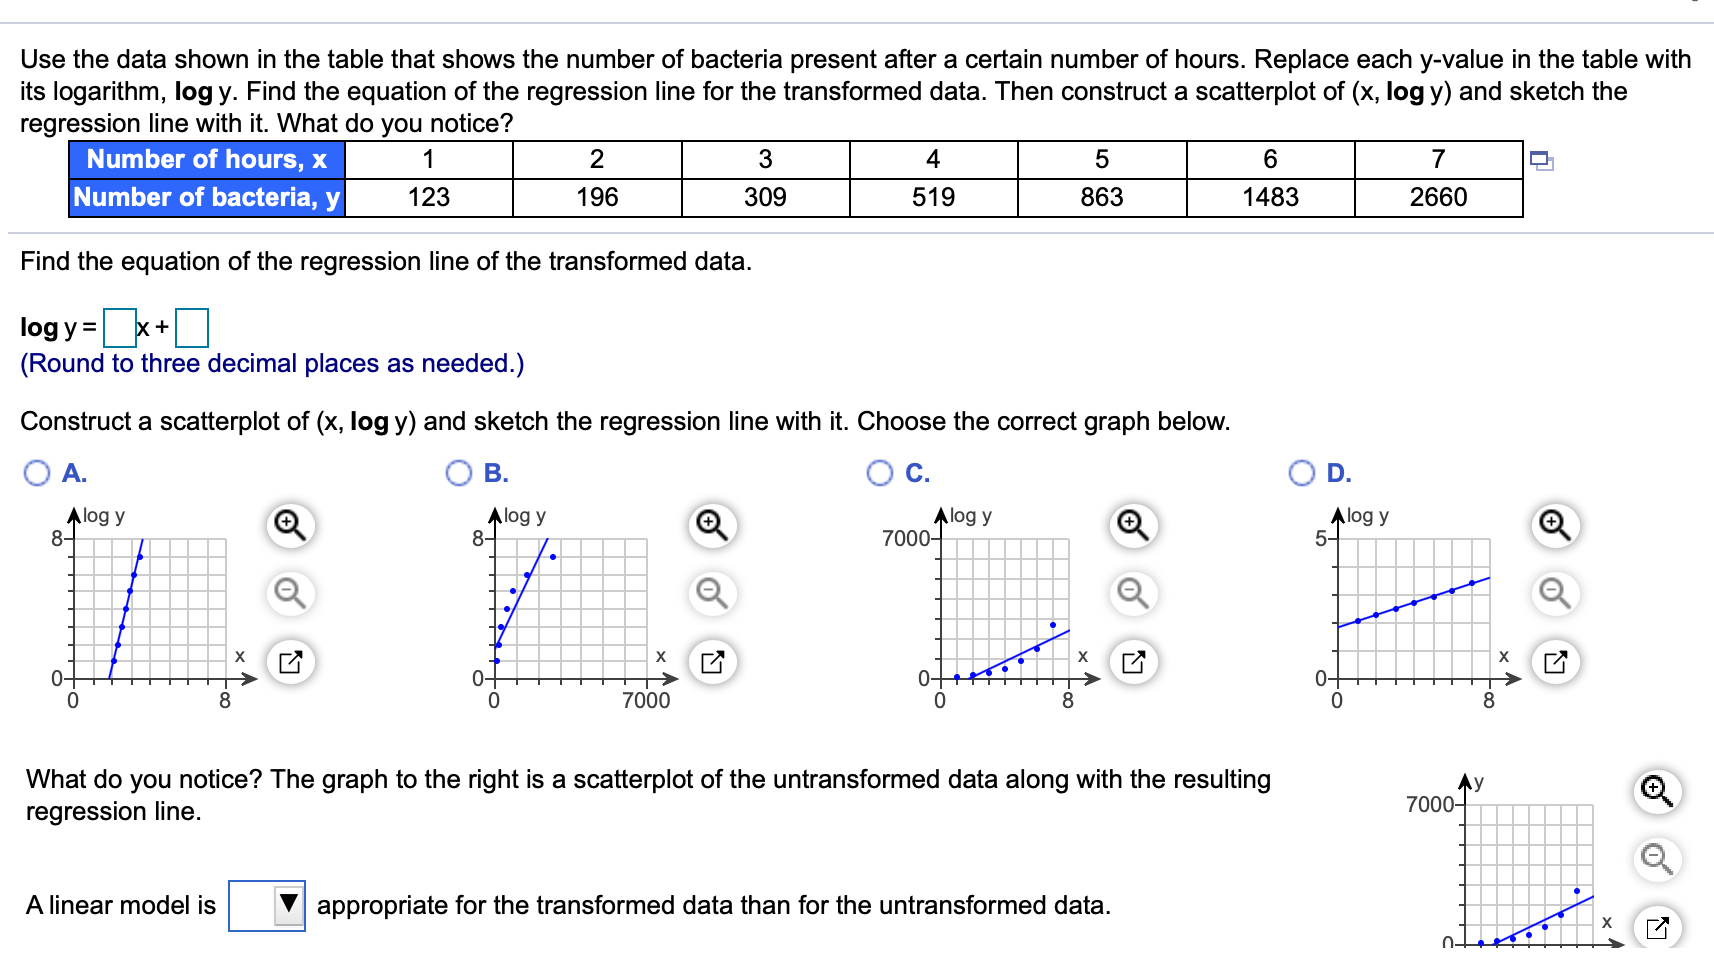
Question: Use the data shown in the table that shows the number of bacteria present after a certain number of hours. Replace each y-value in the

Use the data shown in the table that shows the

Use the data shown in the table that shows the number of bacteria present after a certain number of hours. Replace each y-value in the table with its logarithm, log y. Find the equation of the regression line for the transformed data. Then construct a scatterplot of (x, log y) and sketch the regression line with it. What do you notice? Number of hours, X 1 2 3 4 5 6 7 Number of bacteria, y 123 196 309 519 863 1483 2660 Find the equation of the regression line of the transformed data. log y=x+ (Round to three decimal places as needed.) Construct a scatterplot of (x, log y) and sketch the regression line with it. Choose the correct graph below. O A. OB. C. OD. Alogy Alogy 8- logy Alogy 8- 7000- 5- . 17 X X 0+ 0 7000 0- 0 8 0 8 What do you notice? The graph to the right is a scatterplot of the untransformed data along with the resulting regression line. Ay 7000- A linear model is appropriate for the transformed data than for the untransformed data

Step by Step Solution

There are 3 Steps involved in it

1 Expert Approved Answer
Step: 1 Unlock blur-text-image
Question Has Been Solved by an Expert!

Get step-by-step solutions from verified subject matter experts

Step: 2 Unlock
Step: 3 Unlock

Students Have Also Explored These Related General Management Questions!