

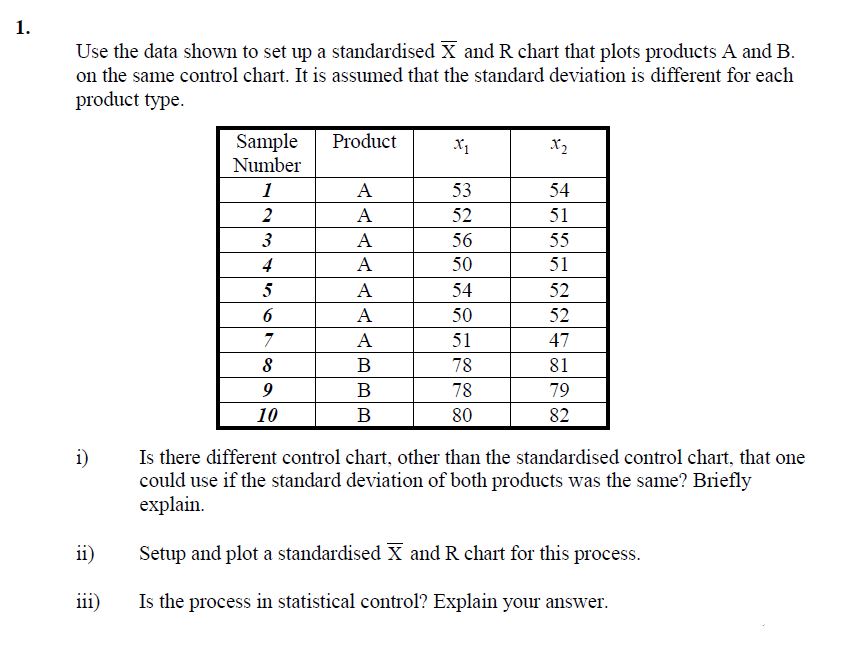
Question: Use the data shown to set up a standardised x and R chart that plots products A and B . on the same control chart.
Use the data shown to set up a standardised and chart that plots products A and
on the same control chart. It is assumed that the standard deviation is different for each
product type.
i Is there different control chart, other than the standardised control chart, that one
could use if the standard deviation of both products was the same? Briefly
explain.
ii Setup and plot a standardised and chart for this process.
iii Is the process in statistical control? Explain your answer.
Step by Step Solution
There are 3 Steps involved in it
1 Expert Approved Answer
Step: 1 Unlock

Question Has Been Solved by an Expert!
Get step-by-step solutions from verified subject matter experts
Step: 2 Unlock
Step: 3 Unlock