

Question: Use the data shown to set up an x and R control chart that plots products A and B on the same control chart. It
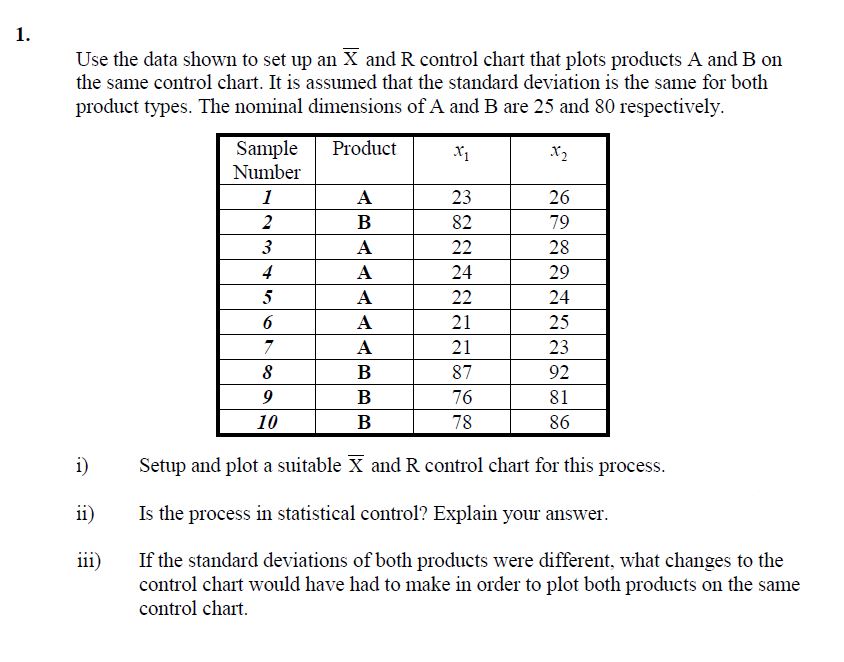
Use the data shown to set up an and control chart that plots products A and on
the same control chart. It is assumed that the standard deviation is the same for both
product types. The nominal dimensions of A and B are and respectively.
i Setup and plot a suitable and control chart for this process.
ii Is the process in statistical control? Explain your answer.
iii If the standard deviations of both products were different, what changes to the
control chart would have had to make in order to plot both products on the same
control chart.
Step by Step Solution
There are 3 Steps involved in it
1 Expert Approved Answer
Step: 1 Unlock

Question Has Been Solved by an Expert!
Get step-by-step solutions from verified subject matter experts
Step: 2 Unlock
Step: 3 Unlock