

Question: Use the data table to answer these. Using Desmos, construct a scatter plot with the time on the ?-axis (as the independent variable) ?and the
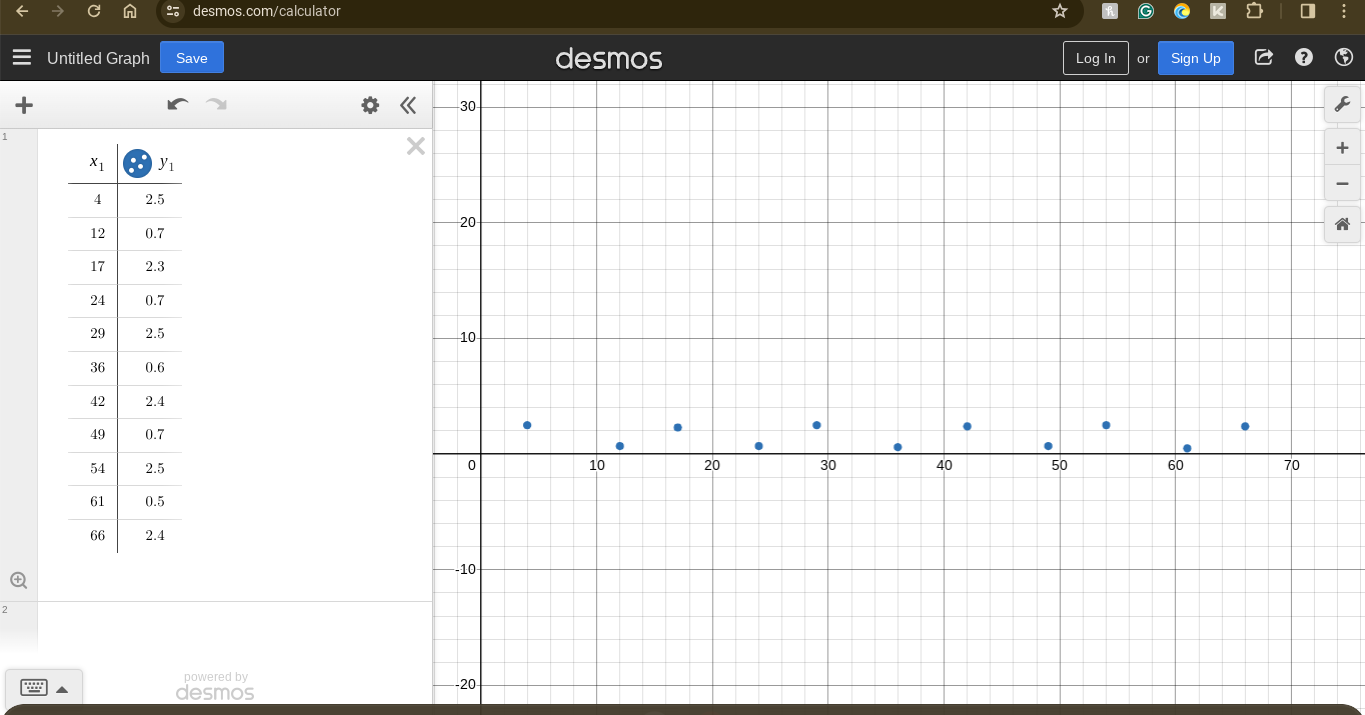
Use the data table to answer these. Using Desmos, construct a scatter plot with the time on the ?-axis (as the independent variable) ?and the height on the ?-axis
(as the dependent variable). ?Save your scatter plot as you will need it for step 4.
Step 3: Show all work and calculations to determine a sine function (in the form y=asink(x-d)+c) ?and a cosine
function (in the form y=acosk(x-d)+c) ?that model the data you have researched. Provide a detailed explanation
of the steps you took to determine the value of the parameters in each of your equations.
Step 4: Use Desmos to plot both of your trigonometric functions on the same graph as your data points from Step 2. ?Include a link to
your Desmos graph in your submission.
Step 5: Provide a detailed reflection on the accuracy of both of your models. Propose reasons for any inaccuracies or irregularities. The data table will be attached.
2% desmos.com/calculator G O = Untitled Graph Save desmos Log In or Sign Up ? +
Step by Step Solution
There are 3 Steps involved in it

Get step-by-step solutions from verified subject matter experts