

Question: Use the Data Table What-If Analysis Tool in Excel to calculate the answers for Scenario 1 and Scenario 2. Hint: Don't forget that the warehouse
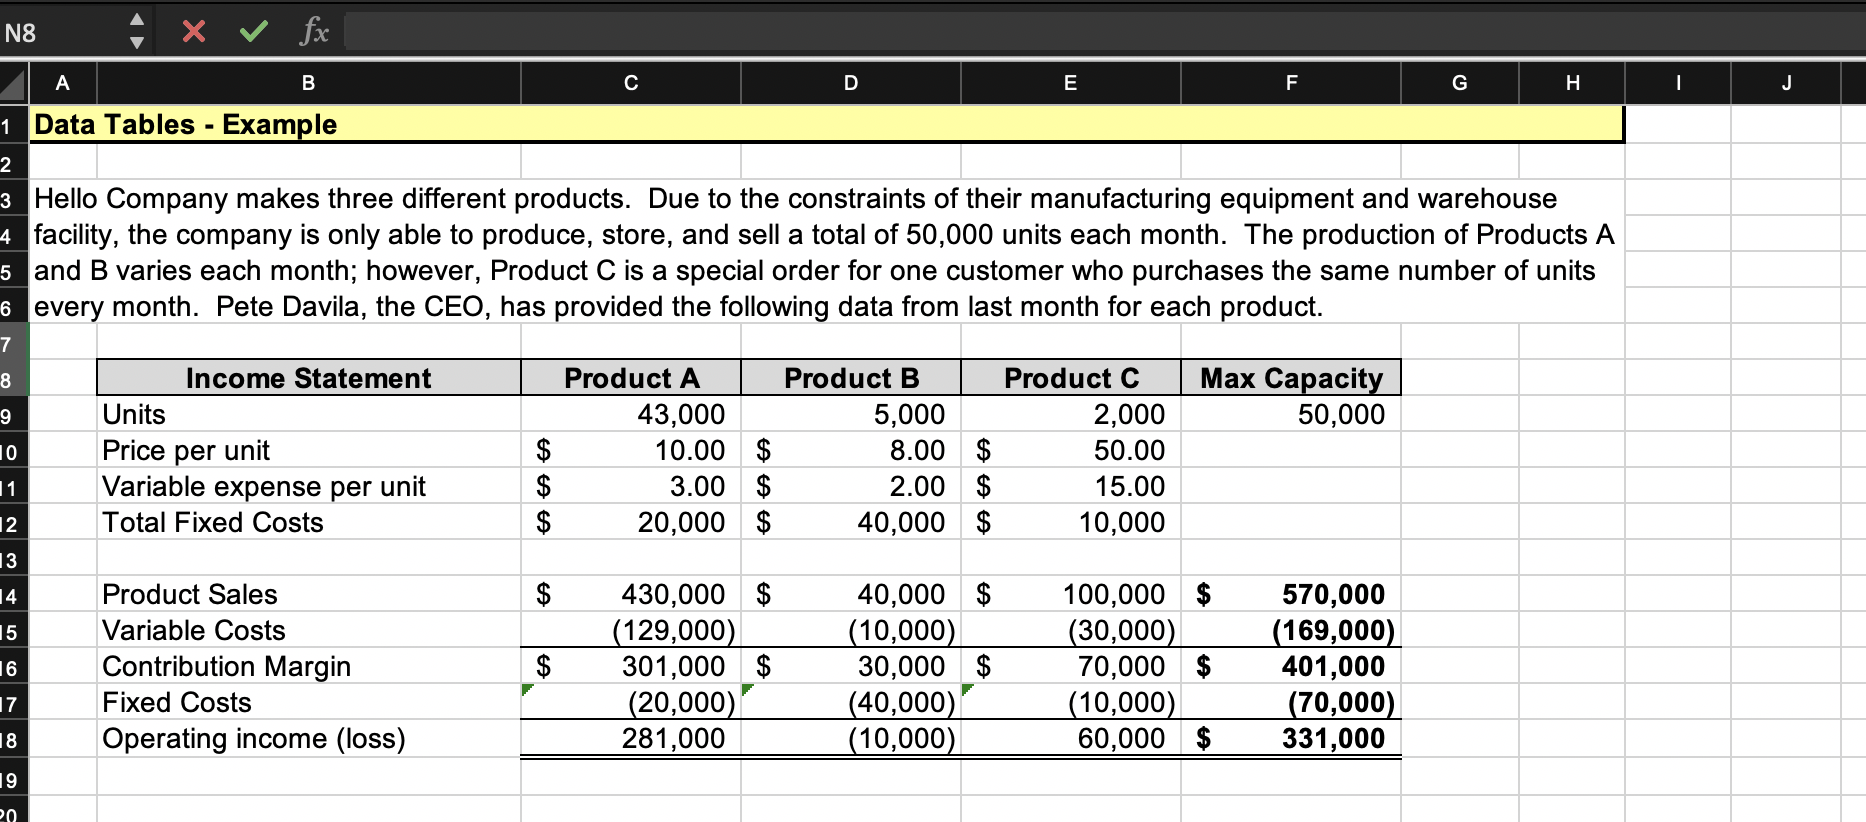
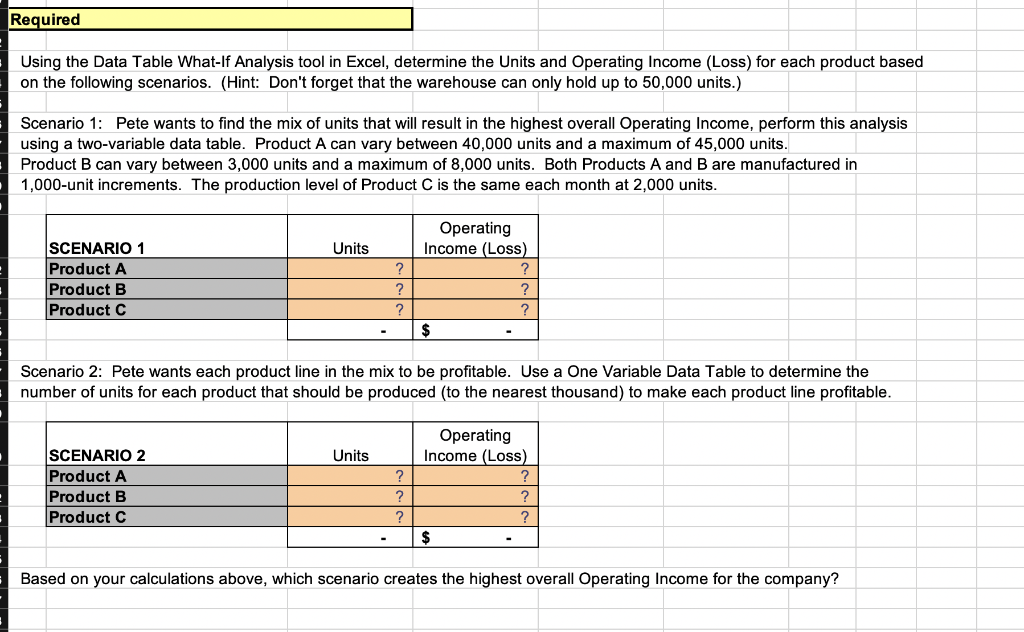
N8 x fx B C D E F G H - J 1 Data Tables - Example 2 3 Hello Company makes three different products. Due to the constraints of their manufacturing equipment and warehouse 4 facility, the company is only able to produce, store, and sell a total of 50,000 units each month. The production of Products A 5 and B varies each month; however, Product C is a special order for one customer who purchases the same number of units 6 every month. Pete Davila, the CEO, has provided the following data from last month for each product. 7 8 Max Capacity 50,000 9 10 Income Statement Units Price per unit Variable expense per unit Total Fixed Costs Product A 43,000 10.00 $ 3.00 $ 20,000 $ $ $ $ Product B Product C 5,000 2,000 8.00 $ 50.00 2.00 $ 15.00 40,000 $ 10,000 11 12 13 14 $ 15 Product Sales Variable Costs Contribution Margin Fixed Costs Operating income (loss) 16 430,000 $ (129,000) 301,000 $ (20,000) 281,000 : $ 40,000 $ (10,000) 30,000 $ (40,000) (10,000) 100,000 $ (30,000) 70,000 $ (10,000) 60,000 $ 570,000 (169,000) 401,000 (70,000) 331,000 17 18 19 20 Required Using the Data Table What-If Analysis tool in Excel, determine the Units and Operating Income (Loss) for each product based on the following scenarios. (Hint: Don't forget that the warehouse can only hold up to 50,000 units.) Scenario 1: Pete wants to find the mix of units that will result in the highest overall Operating Income, perform this analysis using a two-variable data table. Product A can vary between 40,000 units and a maximum of 45,000 units. Product B can vary between 3,000 units and a maximum of 8,000 units. Both Products A and B are manufactured in 1,000-unit increments. The production level of Product C is the same each month at 2,000 units. Units ? SCENARIO 1 Product A Product B Product C Operating Income (Loss) ? ? ? $ ? ? Scenario 2: Pete wants each product line in the mix to be profitable. Use a One Variable Data Table to determine the number of units for each product that should be produced to the nearest thousand) to make each product line profitable. Units ? SCENARIO 2 Product A Product B Product C Operating Income (Loss) ? ? ? $ 2 ? Based on your calculations above, which scenario creates the highest overall Operating Income for the company? N8 x fx B C D E F G H - J 1 Data Tables - Example 2 3 Hello Company makes three different products. Due to the constraints of their manufacturing equipment and warehouse 4 facility, the company is only able to produce, store, and sell a total of 50,000 units each month. The production of Products A 5 and B varies each month; however, Product C is a special order for one customer who purchases the same number of units 6 every month. Pete Davila, the CEO, has provided the following data from last month for each product. 7 8 Max Capacity 50,000 9 10 Income Statement Units Price per unit Variable expense per unit Total Fixed Costs Product A 43,000 10.00 $ 3.00 $ 20,000 $ $ $ $ Product B Product C 5,000 2,000 8.00 $ 50.00 2.00 $ 15.00 40,000 $ 10,000 11 12 13 14 $ 15 Product Sales Variable Costs Contribution Margin Fixed Costs Operating income (loss) 16 430,000 $ (129,000) 301,000 $ (20,000) 281,000 : $ 40,000 $ (10,000) 30,000 $ (40,000) (10,000) 100,000 $ (30,000) 70,000 $ (10,000) 60,000 $ 570,000 (169,000) 401,000 (70,000) 331,000 17 18 19 20 Required Using the Data Table What-If Analysis tool in Excel, determine the Units and Operating Income (Loss) for each product based on the following scenarios. (Hint: Don't forget that the warehouse can only hold up to 50,000 units.) Scenario 1: Pete wants to find the mix of units that will result in the highest overall Operating Income, perform this analysis using a two-variable data table. Product A can vary between 40,000 units and a maximum of 45,000 units. Product B can vary between 3,000 units and a maximum of 8,000 units. Both Products A and B are manufactured in 1,000-unit increments. The production level of Product C is the same each month at 2,000 units. Units ? SCENARIO 1 Product A Product B Product C Operating Income (Loss) ? ? ? $ ? ? Scenario 2: Pete wants each product line in the mix to be profitable. Use a One Variable Data Table to determine the number of units for each product that should be produced to the nearest thousand) to make each product line profitable. Units ? SCENARIO 2 Product A Product B Product C Operating Income (Loss) ? ? ? $ 2 ? Based on your calculations above, which scenario creates the highest overall Operating Income for the company
Step by Step Solution
There are 3 Steps involved in it

Get step-by-step solutions from verified subject matter experts