

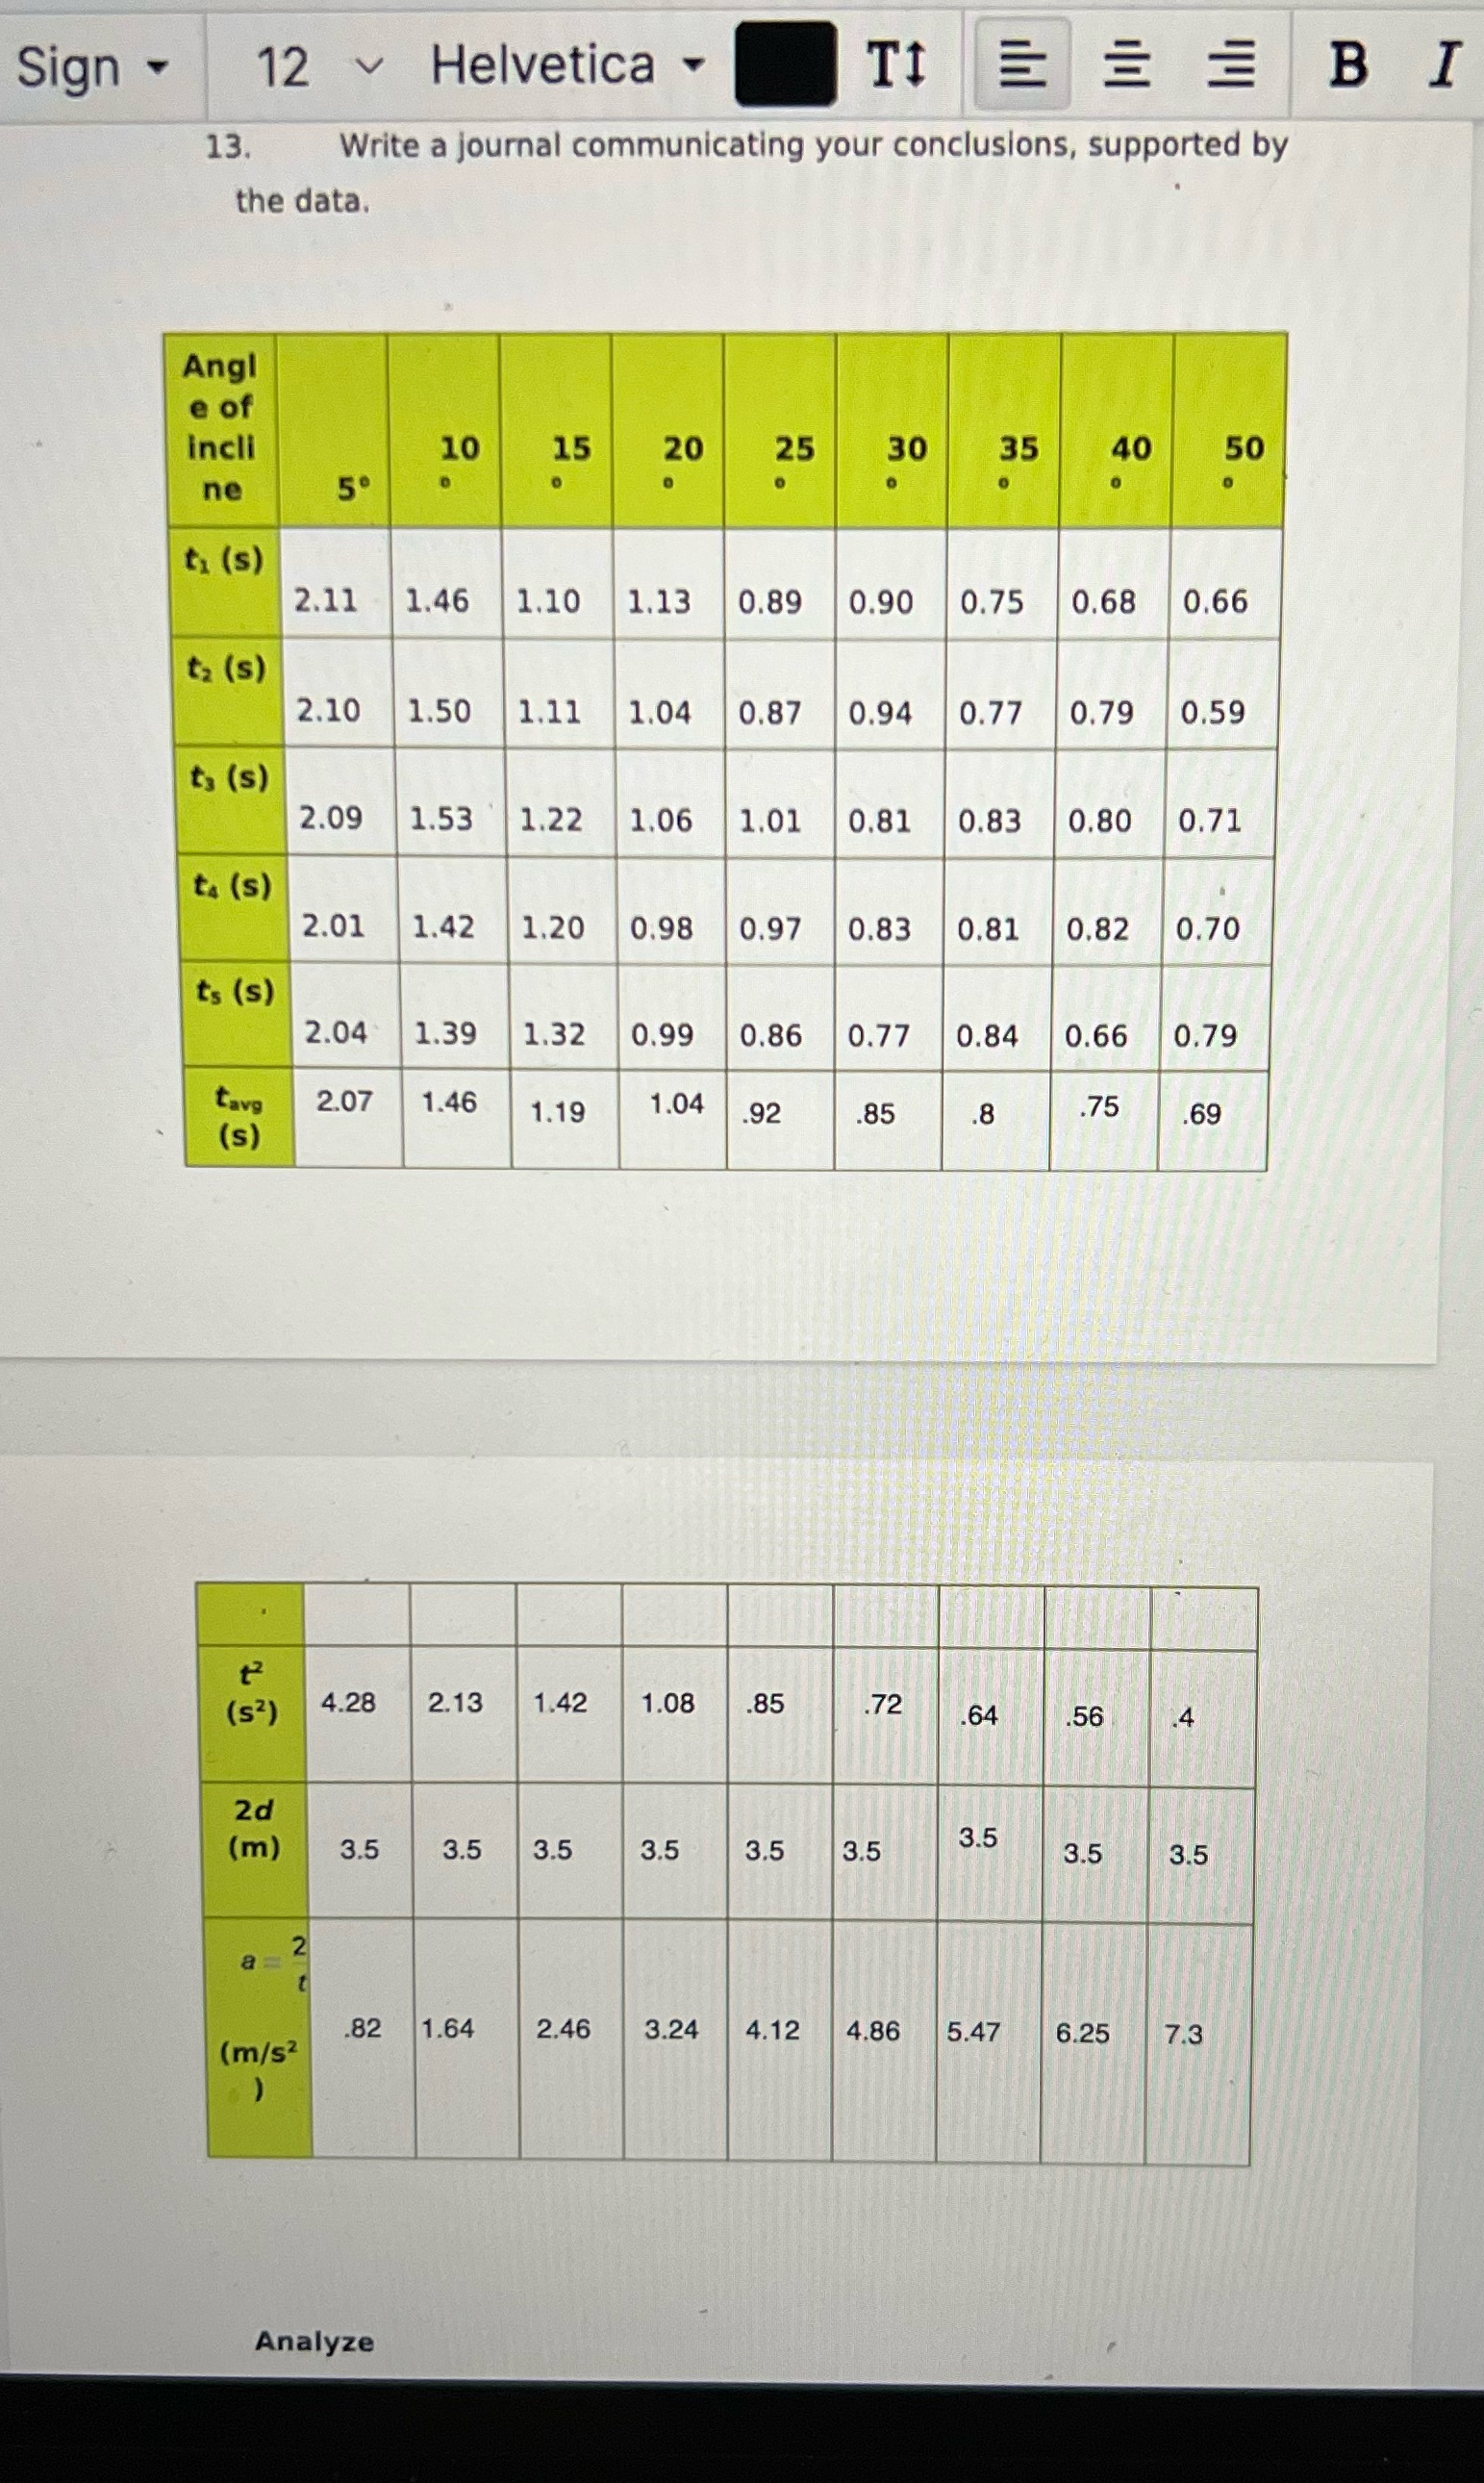
Question: use the data values and your table to sketch a rough graph a velocity versus time for the 10 angle and another for the 40
use the data values and your table to sketch a rough graph a velocity versus time for the 10 angle and another for the 40 angle what value did the slopes of these graphs represent which graph has the greater slope?
Step by Step Solution
There are 3 Steps involved in it
1 Expert Approved Answer
Step: 1 Unlock

Question Has Been Solved by an Expert!
Get step-by-step solutions from verified subject matter experts
Step: 2 Unlock
Step: 3 Unlock