

Question: PLEASE DON'T FORGET THE COMPLETE PYTHON CODE I WILL RATE DATA SET: 1.2537667e+00 1.3860368e+00 9.7941192e-01 1.2941622e+00 1.2424697e+00 1.0824727e+00 1.1725306e+00 1.2528006e+00 1.5790261e+00 1.5007784e+00 1.0914944e+00 1.5326237e+00 1.3043201e+00
PLEASE DON'T FORGET THE COMPLETE PYTHON CODE I WILL RATE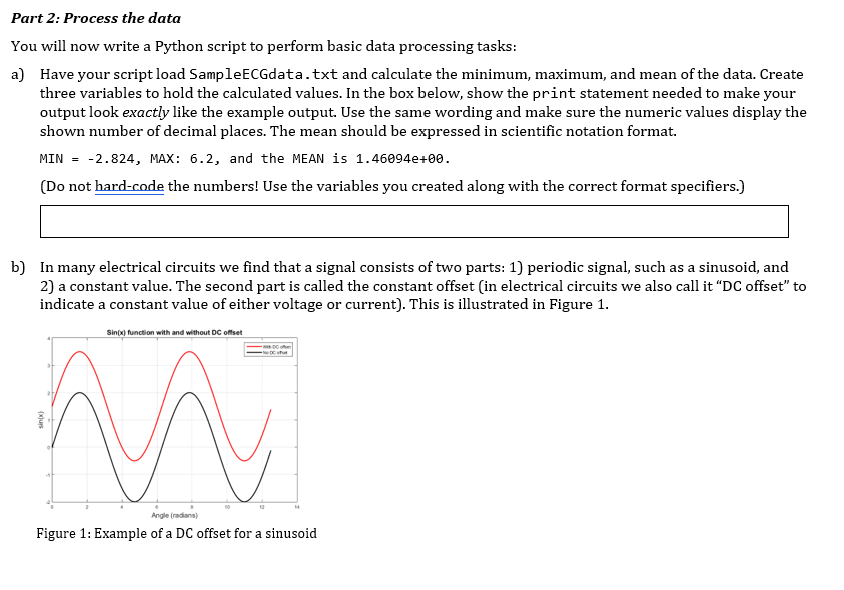
DATA SET:
1.2537667e+00 1.3860368e+00 9.7941192e-01 1.2941622e+00 1.2424697e+00 1.0824727e+00 1.1725306e+00 1.2528006e+00 1.5790261e+00 1.5007784e+00 1.0914944e+00 1.5326237e+00 1.3043201e+00 1.2281225e+00 1.3085506e+00 1.2192280e+00 1.2299584e+00 1.4831506e+00 1.5668921e+00 1.6595159e+00 1.6767542e+00 1.5806637e+00 1.8649442e+00 2.0480518e+00 2.0257255e+00 2.1721134e+00 2.2331405e+00 2.2219158e+00 2.3734549e+00 2.3571474e+00 2.6165232e+00 2.5047845e+00 2.6044124e+00 2.7221575e+00 2.6004868e+00 2.9517774e+00 2.7534825e+00 2.5584947e+00 2.6840415e+00 2.2888840e+00 2.3628355e+00 2.2619391e+00 2.2310286e+00 2.1434179e+00 1.9386681e+00 1.9351751e+00 1.8347164e+00 1.8269991e+00 1.7865790e+00 1.7012039e+00 1.4169353e+00 1.4240606e+00 1.2079371e+00 1.1310228e+00 1.2398456e+00 1.3919513e+00 1.1598794e+00 1.2721416e+00 1.2106029e+00 1.3430547e+00 1.1205704e+00 1.2308902e+00 1.2810449e+00 1.3340109e+00 1.3765288e+00 1.2288584e+00 1.0692640e+00 1.1423505e+00 1.1085802e+00 1.4479418e+00 1.1494936e+00 1.2840192e+00 1.1881273e+00 1.2943879e+00 1.1271997e+00 1.0616154e+00 1.0577624e+00 1.0087064e+00 7.0203650e-01 4.6005567e-01 3.8147904e-01 2.8593500e-02 -2.2089690e-01 4.1352871e-01 6.6974897e-01 1.3152948e+00 1.8245779e+00 2.2121344e+00 2.7535096e+00 3.1107950e+00 3.6080209e+00 4.2287404e+00 4.7859151e+00 5.4676756e+00 5.6378742e+00 6.2187331e+00 5.4844494e+00 4.5920954e+00 4.0341999e+00 3.1913274e+00 2.7475317e+00 1.8673898e+00 1.2589011e+00 4.8713772e-01 -1.3535850e-01 -9.3304440e-01 -1.5313164e+00 -2.2136778e+00 -2.8237265e+00 -2.1753446e+00 -1.5307847e+00 -5.6192500e-01 4.9647638e-01 1.0927845e+00 1.2978985e+00 1.2160112e+00 1.3490790e+00 1.0111224e+00 1.1892457e+00 1.0900341e+00 1.5034225e+00 1.2969467e+00 1.3541251e+00 1.1122130e+00 1.1729726e+00 1.1943903e+00 1.3332828e+00 1.1974562e+00 1.2972007e+00 1.0236680e+00 1.1952677e+00 1.1500972e+00 1.0765532e+00 1.2868595e+00 1.2660635e+00 1.2430162e+00 1.1081035e+00 1.3560237e+00 1.2800955e+00 1.2169740e+00 1.2509727e+00 1.2242873e+00 1.0772687e+00 1.2255279e+00 1.1727595e+00 1.1597786e+00 1.1438622e+00 1.2079497e+00 1.0628450e+00 1.3613346e+00 1.3187208e+00 1.2665151e+00 1.2668438e+00 1.1923077e+00 1.3757957e+00 1.2624085e+00 1.2060803e+00 1.4144750e+00 1.2586625e+00 1.2240398e+00 1.2553704e+00 1.2423260e+00 1.2574787e+00 1.6644644e+00 1.6197871e+00 1.5273637e+00 1.4132712e+00 1.4948091e+00 1.6060754e+00 1.7452433e+00 1.5752741e+00 1.5178607e+00 1.6483106e+00 1.8689443e+00 1.9171015e+00 1.9655069e+00 1.9496834e+00 2.0234537e+00 1.9998423e+00 2.1760327e+00 1.9089341e+00 2.0458796e+00 1.8707788e+00 1.8774341e+00 1.9214742e+00 1.9253780e+00 1.6649781e+00 1.8580809e+00 1.7533025e+00 1.6357746e+00 1.5783122e+00 1.5313467e+00 1.4780696e+00 1.4659581e+00 1.4240556e+00 1.4568059e+00 1.4821704e+00 1.3314372e+00 1.2560703e+00 1.3318565e+00 1.2799560e+00 1.1509524e+00 1.3411471e+00 1.2692270e+00 1.2443341e+00 1.2746371e+00 1.2415490e+00 1.1135556e+00 1.1837662e+00 1.1853945e+00 1.1467989e+00 1.3682104e+00 1.1124271e+00 1.1516185e+00 1.1287995e+00 1.0825788e+00 1.1807760e+00 1.1725930e+00 1.3530072e+00 1.1750975e+00 1.0935787e+00 1.3603457e+00 1.3234679e+00 1.1770374e+00 1.0493840e+00 1.1555372e+00 1.1844059e+00 1.2276068e+00 1.1738836e+00 1.2443422e+00 1.2391894e+00 1.0749321e+00 1.1052039e+00 1.1258894e+00 1.1492182e+00 1.1679424e+00 1.2012469e+00 8.9708227e-01 1.1542985e+00 1.3242448e+00 1.0933299e+00 1.2933728e+00 1.2350321e+00 1.1970994e+00 1.2182452e+00 1.0434944e+00 1.1915461e+00 1.3603946e+00 1.2098348e+00 1.2041374e+00 1.1265831e+00 1.1969186e+00 1.2232347e+00 1.2426388e+00 1.1627191e+00 1.1763545e+00
Part 2: Process the data You will now write a Python script to perform basic data processing tasks: a) Have your script load SampleECGdata.txt and calculate the minimum, maximum, and mean of the data. Create three variables to hold the calculated values. In the box below, show the print statement needed to make your output look exactly like the example output. Use the same wording and make sure the numeric values display the shown number of decimal places. The mean should be expressed in scientific notation format. MIN = -2.824, MAX: 6.2, and the MEAN is 1.46094e+00. (Do not hard-code the numbers! Use the variables you created along with the correct format specifiers.) b) In many electrical circuits we find that a signal consists of two parts: 1) periodic signal, such as a sinusoid, and 2) a constant value. The second part is called the constant offset (in electrical circuits we also call it "DC offset" to indicate a constant value of either voltage or current). This is illustrated in Figure 1. Sin(x) function with and without DC offset Sink M. -1 13 14 Angle (radians) Figure 1: Example of a DC offset for a sinusoid In the ECG recording this constant offset may be an undesirable artifact of the measurement. In your script, write code to correct the recording so that the data is centered about zero in the vertical direction, i.e., remove the DC offset. To do this, either add or subtract (you decide) the previously calculated mean value from each of the data points. Have your code determine the mean of the DC corrected signal and display it. What is the mean value of the corrected signal? Hint: It does not have to be exactly zero, but close to it. c) Have your script make a plot of your DC corrected signal with appropriate axes labels, a title, and legend. a Copy and paste your image here. d) Compressing a sampled signal can reduce the amount of storage memory required or increase processing speeds. Subsampling is done by indexing the array, but instead of using just two indices, there are three values to specify. The first value is the starting index, the second value is the terminating index, and the third value is the step or stride (how many samples to skip over). For example, to select every other sample up to the fifth sample from a NumPy 1-D array named myVector that contains the values 10, 24, 17,42, 56, 33, 7, you could type: myNewlecter = myVector [0:6:2] # Remember to set array ending index to 1 more than desired end In this case, myNewVector would contain only the values 10, 17,56. In your script, prompt the user to enter an integer value. Next, use that value to subsample the SampleEco variable by taking every n-th sample, where n is the user input. Verify that your subsampling was effective by displaying the number of samples in your new subarray. Example Output: Please enter the desired subsample rate: 10 The length of the subsampled ECG is 26. For a subsample rate of 23, what is the length of the subsampled ECG? e) Make the script generate a plot of the original ECG waveform, a subsampled version for n=2, and another subsampled version for n=10. All of the waveforms should be on the same plot. Include labels, title, and legend. Copy and paste your image here. f) What trends or patterns do you observe in the plot? What important conclusion can you draw if you keep increasing the n value for subsampling? g) Recall that the original ECG data file did NOT contain any time information, i.e., the file only had y-axis (voltage) values but no x-axis (time) values. Create a proper time axis using the given sampling rate information and employing the Numpy linspaced) function. The x-axis should cover a span of one second in total. Finally, have your script pass both the time array and the original SampleECG array as arguments to the plot() function to generate a graph of voltage versus time (not voltage versus index). Add labels and a title. Copy and paste your image here. Part 2: Process the data You will now write a Python script to perform basic data processing tasks: a) Have your script load SampleECGdata.txt and calculate the minimum, maximum, and mean of the data. Create three variables to hold the calculated values. In the box below, show the print statement needed to make your output look exactly like the example output. Use the same wording and make sure the numeric values display the shown number of decimal places. The mean should be expressed in scientific notation format. MIN = -2.824, MAX: 6.2, and the MEAN is 1.46094e+00. (Do not hard-code the numbers! Use the variables you created along with the correct format specifiers.) b) In many electrical circuits we find that a signal consists of two parts: 1) periodic signal, such as a sinusoid, and 2) a constant value. The second part is called the constant offset (in electrical circuits we also call it "DC offset" to indicate a constant value of either voltage or current). This is illustrated in Figure 1. Sin(x) function with and without DC offset Sink M. -1 13 14 Angle (radians) Figure 1: Example of a DC offset for a sinusoid In the ECG recording this constant offset may be an undesirable artifact of the measurement. In your script, write code to correct the recording so that the data is centered about zero in the vertical direction, i.e., remove the DC offset. To do this, either add or subtract (you decide) the previously calculated mean value from each of the data points. Have your code determine the mean of the DC corrected signal and display it. What is the mean value of the corrected signal? Hint: It does not have to be exactly zero, but close to it. c) Have your script make a plot of your DC corrected signal with appropriate axes labels, a title, and legend. a Copy and paste your image here. d) Compressing a sampled signal can reduce the amount of storage memory required or increase processing speeds. Subsampling is done by indexing the array, but instead of using just two indices, there are three values to specify. The first value is the starting index, the second value is the terminating index, and the third value is the step or stride (how many samples to skip over). For example, to select every other sample up to the fifth sample from a NumPy 1-D array named myVector that contains the values 10, 24, 17,42, 56, 33, 7, you could type: myNewlecter = myVector [0:6:2] # Remember to set array ending index to 1 more than desired end In this case, myNewVector would contain only the values 10, 17,56. In your script, prompt the user to enter an integer value. Next, use that value to subsample the SampleEco variable by taking every n-th sample, where n is the user input. Verify that your subsampling was effective by displaying the number of samples in your new subarray. Example Output: Please enter the desired subsample rate: 10 The length of the subsampled ECG is 26. For a subsample rate of 23, what is the length of the subsampled ECG? e) Make the script generate a plot of the original ECG waveform, a subsampled version for n=2, and another subsampled version for n=10. All of the waveforms should be on the same plot. Include labels, title, and legend. Copy and paste your image here. f) What trends or patterns do you observe in the plot? What important conclusion can you draw if you keep increasing the n value for subsampling? g) Recall that the original ECG data file did NOT contain any time information, i.e., the file only had y-axis (voltage) values but no x-axis (time) values. Create a proper time axis using the given sampling rate information and employing the Numpy linspaced) function. The x-axis should cover a span of one second in total. Finally, have your script pass both the time array and the original SampleECG array as arguments to the plot() function to generate a graph of voltage versus time (not voltage versus index). Add labels and a title. Copy and paste your image here
Step by Step Solution
There are 3 Steps involved in it

Get step-by-step solutions from verified subject matter experts