Question: Use the dataset in the ev worksheet. Modify the worksheet as follows: - Rename the worksheet q1 a and position it sequentially in your workbook.
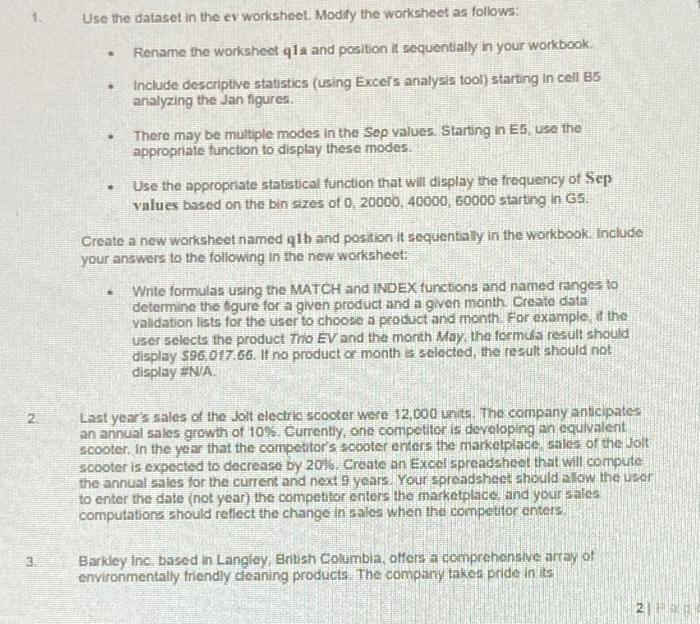
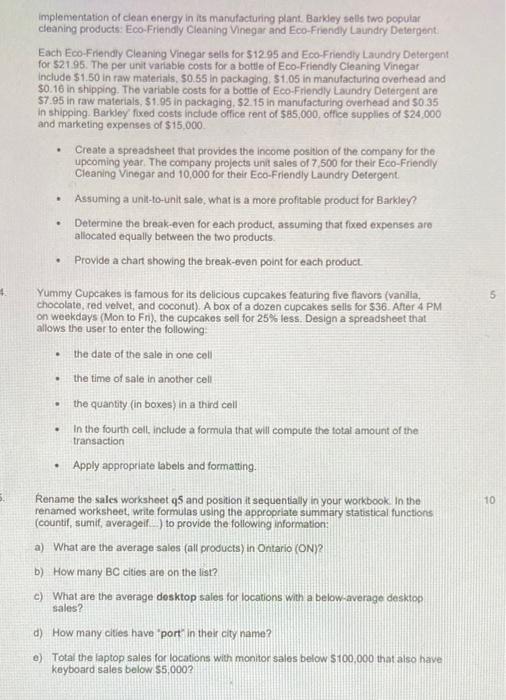
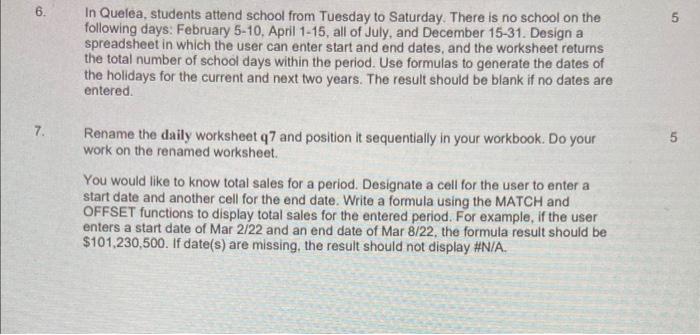
Use the dataset in the ev worksheet. Modify the worksheet as follows: - Rename the worksheet q1 a and position it sequentially in your workbook. - Include descriptive statistics (using Excels analysis tool) starting in cell B5 analyzing the Jan figures. There may be multiple modes in the Sep values. Starting in E5, use the appropriate function to display these modes. Use the appropriate statistical function that will display the frequency of Scp values based on the bin stzes of 0,20000,40000,60000 starting in 65 . Create a new worksheet named q ib and postion it sequentially in the workbook. Include your answers to the following in the new worksheet. - Write formulas using the MATCH and INDEX functions and named inges to determine the flgure for a given product and a given month. Ereate dita validation lists for the user to choose a product and month. For example, if the user sclects the product Tho EV and the month May, the formula result should display 596,017.66. If no product or month is selected, the result should not display #NA. Last year's sales of the Jolt electria scooter were 12,000 units. The company anticipates an annual sales growth of 10%. Currently, one competitor is developing an equivalent. scooter. In the year that the competitors scooter enters the marketplace, sales of the Jolt scooter is expected to decrease by 207 . Create an Excel spreadsheot that will compute the annual sales for the current and next 9 years. Your spreadsheet should alow the usor to enter the date (not year) the competitor enters the marketplace and your saies. computations should reflect the change in sales when the competifor anters. Barkley inc, based in Langley, British Columbia, otters a comprehenswe artay of environmentaily friendly deaning products. The company takes pride in its implementation of clean energy in its manufacturing plant. Barkley sells two poputar cleaning products: Eco-Friendly Cleaning Vinegar and Eco-Friendly Laundry Detergent. Each Eco-Friendly Cleaning Vinegar sells for $12.95 and Eco-Friendly Laundry Dotergent for \$21.95. The per unit variable costs for a botte of Eco-Friendly Cleaning Vinegat include $1.50 in raw materials, 50.55 in packaging. $1.05 in manulacturing overtiead and $0.16 in shipping. The varlable costs for a bottie of Eco-Friendly Laundry Detergent are $7.95 in raw matorials, \$1.95 in packaging, \$2.15 in manufacturing overhead and 50.35 in shipping. Barkley fixed costs inctude office rent of $85,000, office supplies of $24,000 and marketing expenses of $15,000. - Create a spreadsheet that provides the income position of the company for the upcoming year. The company projects unit saies of 7,500 for their Eco-Friendly Cleaning Vinegar and 10,000 for their Eco-Friendly Laundry Detergent. - Assuming a unt-to-unit sale, what is a more profitable product for Barkley? - Determine the break-even for each product, assuming that fixed expenses aro allocated equally between the two products. - Provide a chart showing the break-even point for each product. Yummy Cupcakes is famous for its delicious cupcakes featuring five flavors (vanilia, chocolate, red velvet, and coconut). A box of a dozen cupcakes sells for $36. After 4 PM on weekdays (Mon to Fri), the cupcakes sell for 25% less. Design a spreadsheet that allows the user to enter the following: - the date of the sale in one cell - the time of sale in another cell. - the quantity (in boxes) in a third cell - In the fourth cell. include a formula that will compute the total amount of the transaction - Apply appropriate labels and formatting. Rename the sales worksheet 95 and position it sequentially in your workbook in the renamed worksheet, write formulas using the appropriate summary statistical functions (countif, sumif, averageif - ) to provide the following information: a) What are the average sales (all products) in Ontario (ON)? b) How many BC cities are on the list? c) What are the average desktop sales for locations with a below average desktop sales? d) How many clies have 'port' in their city name? e) Total the laptop sales for locations with monitor sales below 5100,000 that also have koyboard sales below 55,000 ? In Quelea, students attend school from Tuesday to Saturday. There is no school on the following days: February 5-10, April 1-15, all of July, and December 15-31. Design a spreadsheet in which the user can enter start and end dates, and the worksheet returns the total number of school days within the period. Use formulas to generate the dates of the holidays for the current and next two years. The result should be blank if no dates are entered. Rename the daily worksheet q7 and position it sequentially in your workbook. Do your work on the renamed worksheet. You would like to know total sales for a period. Designate a cell for the user to enter a start date and another cell for the end date. Write a formula using the MATCH and OFFSET functions to display total sales for the entered period. For example, if the user enters a start date of Mar 2/22 and an end date of Mar 8/22, the formula result should be $101,230,500. If date(s) are missing, the result should not display #N/A