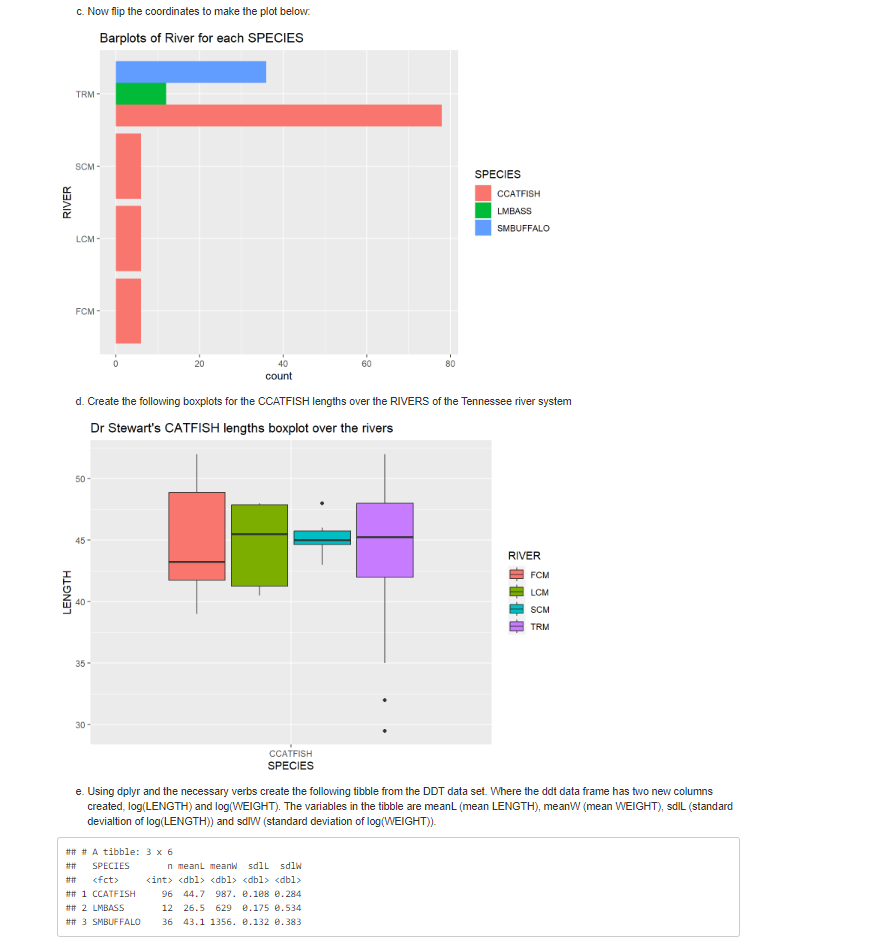
Question: Use the DDT data set in R: C. Now flip the coordinates to make the plot below. Barplots of River for each SPECIES TRM -

Use the DDT data set in R:

Use the DDT data set in R: C. Now flip the
C. Now flip the coordinates to make the plot below. Barplots of River for each SPECIES TRM - SCM SPECIES CCATFISH RIVER MBASS SMBUFFALO LCM FCM - 20 40 60 80 count d. Create the following boxplots for the CCATFISH lengths over the RIVERS of the Tennessee river system Dr Stewart's CATFISH lengths boxplot over the rivers 50 45 RIVER FCM LENGTH LCM 40 SCM TRM 35 30 CCATFISH SPECIES e. Using dplyr and the necessary verbs create the following tibble from the DDT data set. Where the ddt data frame has two new columns created, log(LENGTH) and log(WEIGHT). The variables in the tibble are meant (mean LENGTH), meanW (mean WEIGHT), sdIL (standard devialtion of log(LENGTH)) and sdiW (standard deviation of log(WEIGHT)). # # A tibble: 3 x 6 SPECIES n meant meanw sdll sdlw ## 1 CCATFISH 96 44.7 987. 0. 108 0. 284 2 LMBASS 12 26.5 629 0.175 0.534 # 3 SMBUFFALO 36 43.1 1356. 0. 132 0.383

Step by Step Solution

There are 3 Steps involved in it

1 Expert Approved Answer
Step: 1 Unlock blur-text-image
Question Has Been Solved by an Expert!

Get step-by-step solutions from verified subject matter experts

Step: 2 Unlock
Step: 3 Unlock

Students Have Also Explored These Related Mathematics Questions!