

Question: f. Using the DDT data set, make the following scatterplot for all fish o the TRM river, by adding a smoother (method = Im, formula
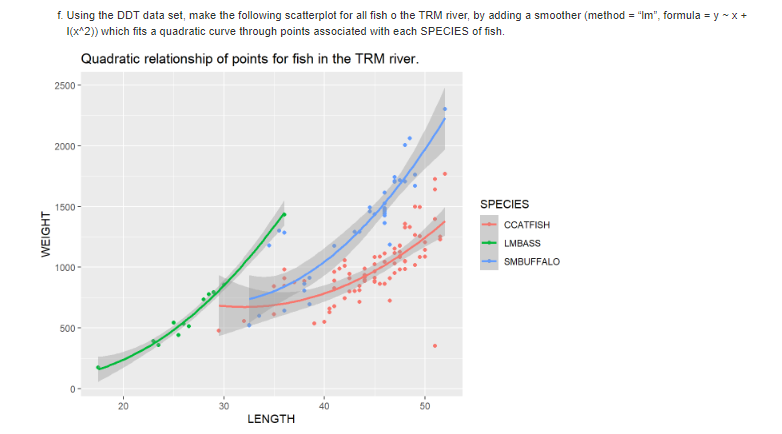
f. Using the DDT data set, make the following scatterplot for all fish o the TRM river, by adding a smoother (method = "Im", formula = y ~ x + 1(x*2)) which fits a quadratic curve through points associated with each SPECIES of fish. Quadratic relationship of points for fish in the TRM river. 2500 - 2000 - 1500 - SPECIES CCATFISH WEIGHT LMBASS 1000 - SMBUFFALO 500 - 0 - 20 30 40 50 LENGTH
Step by Step Solution
There are 3 Steps involved in it
1 Expert Approved Answer
Step: 1 Unlock

Question Has Been Solved by an Expert!
Get step-by-step solutions from verified subject matter experts
Step: 2 Unlock
Step: 3 Unlock