

Question: Use the document titled Graphs for MDS and Conjoint and refer to the course pack reading titled Markstrat: MDS and Conjoint Analysis to answer the
Use the document titled "Graphs for MDS and Conjoint" and refer to the course pack reading titled "Markstrat: MDS and Conjoint Analysis" to answer the following questions. Note - these studies are pulled from a previous version of the Markstrat simulation, so learning how to read and interpret these studies properly will help with your performance in the simulation. You may also find it helpful to refer to the Markstrat Handbook for additional information/examples. Data from more than one table/graph may be needed to answer each question completely.
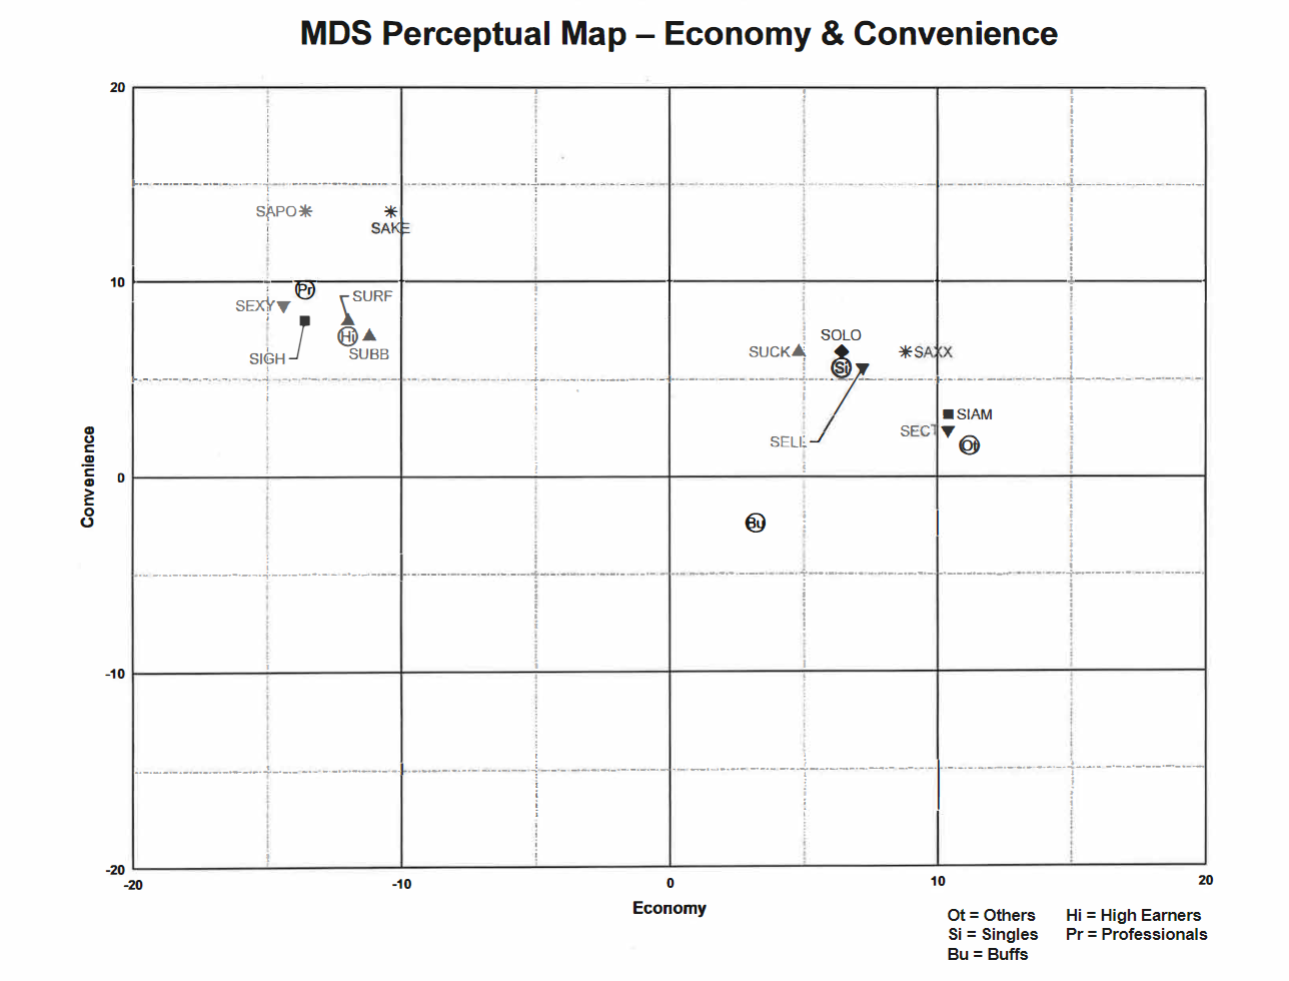
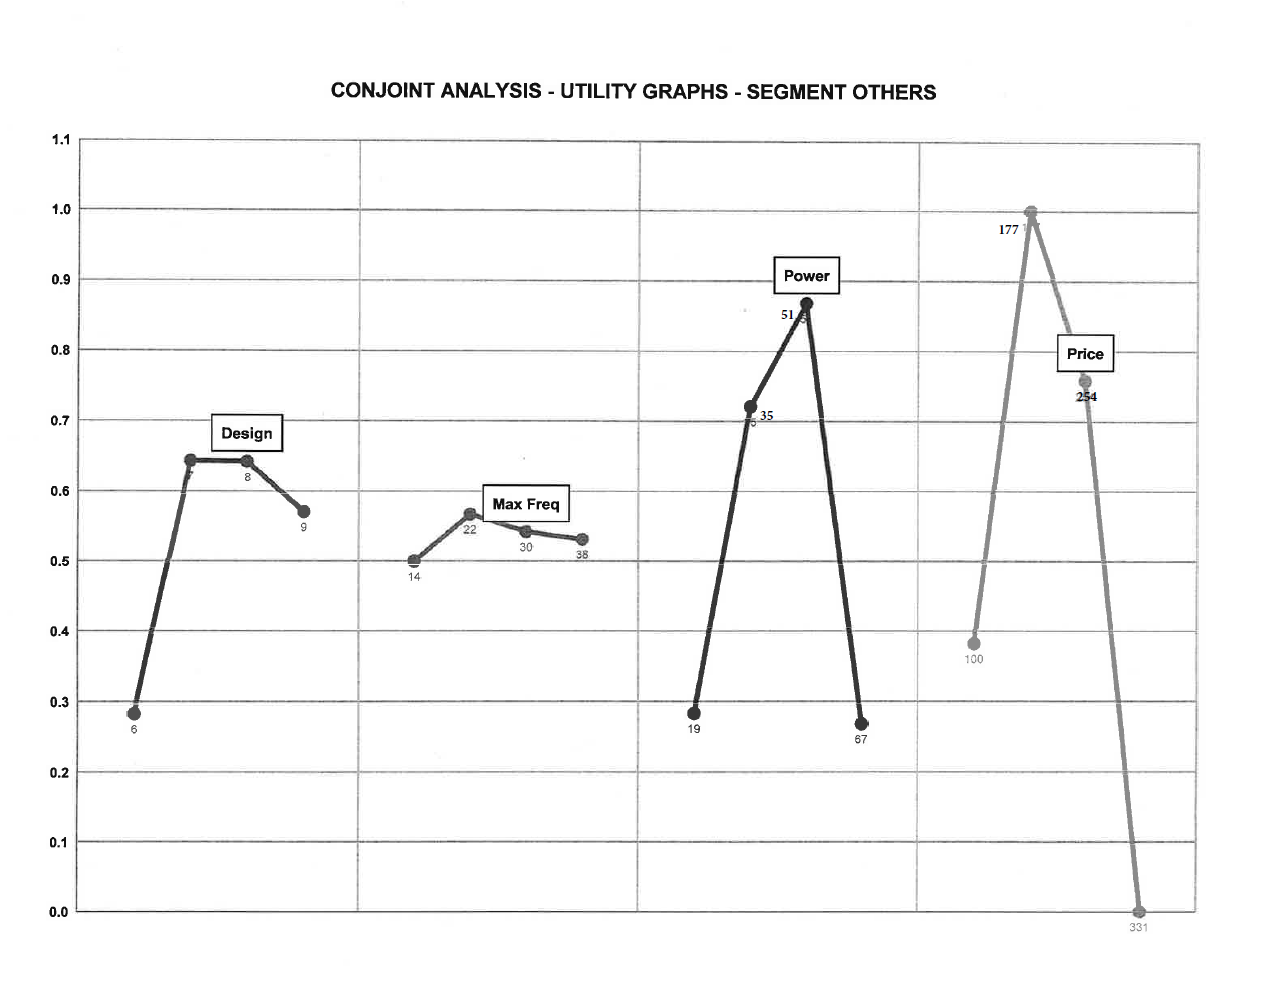
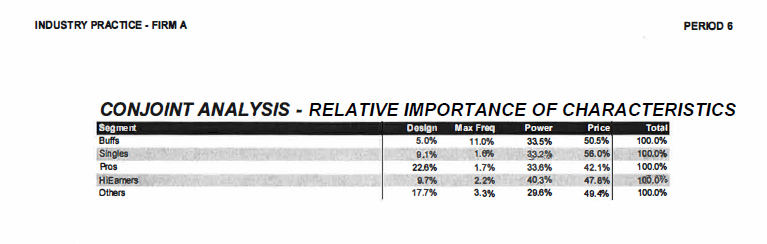
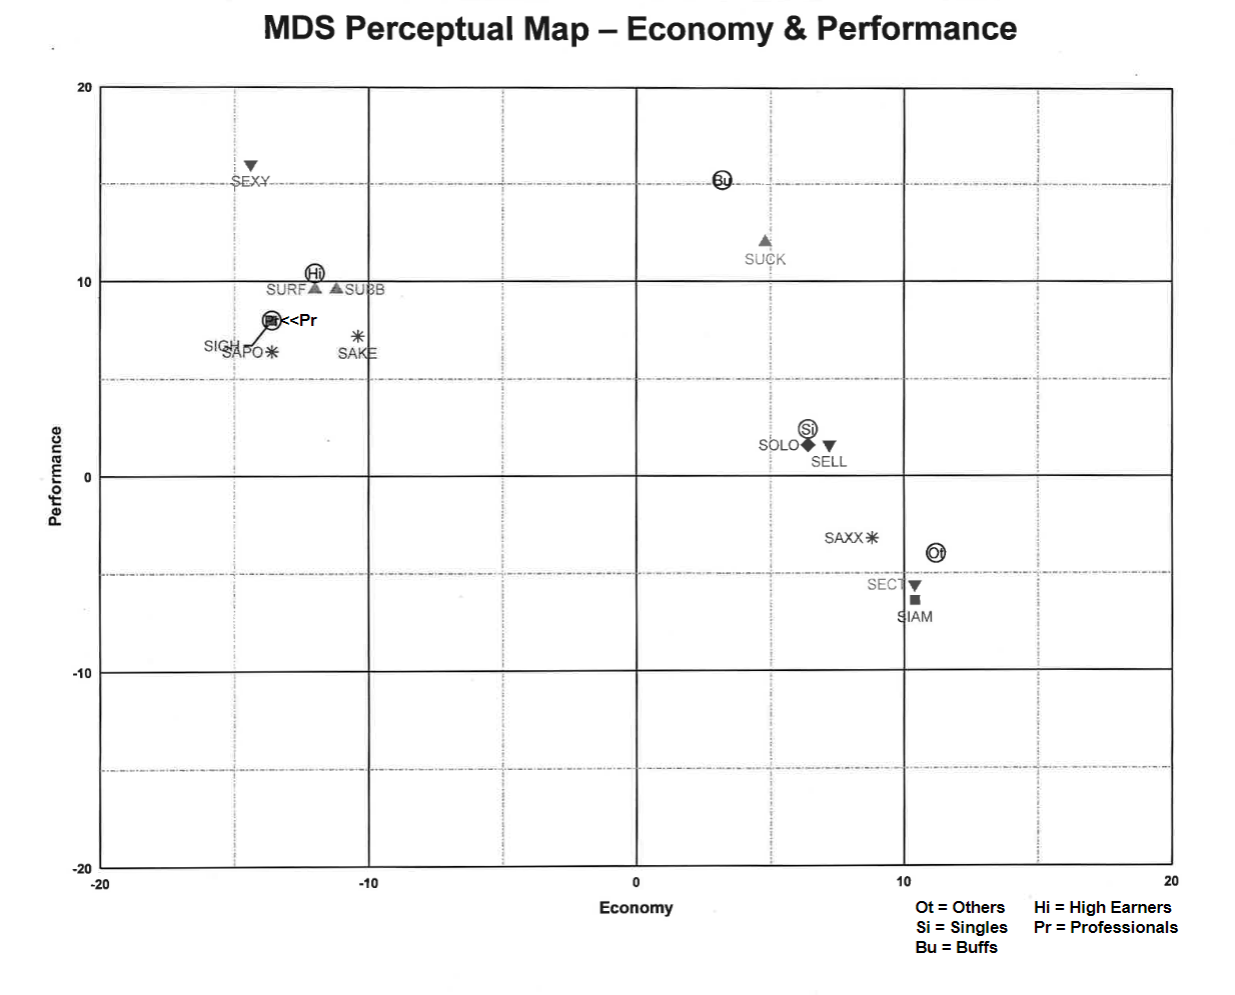
- According to the MDS perceptual maps, which brand or brands on the market is/are best positioned to target the "Professionals" segment? Why? Note - to answer this question completely, you will need to use more information than what is provided by the MDS map.
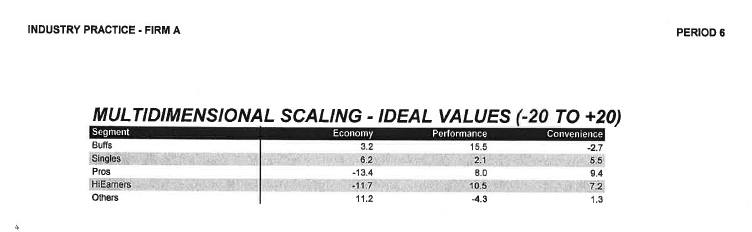
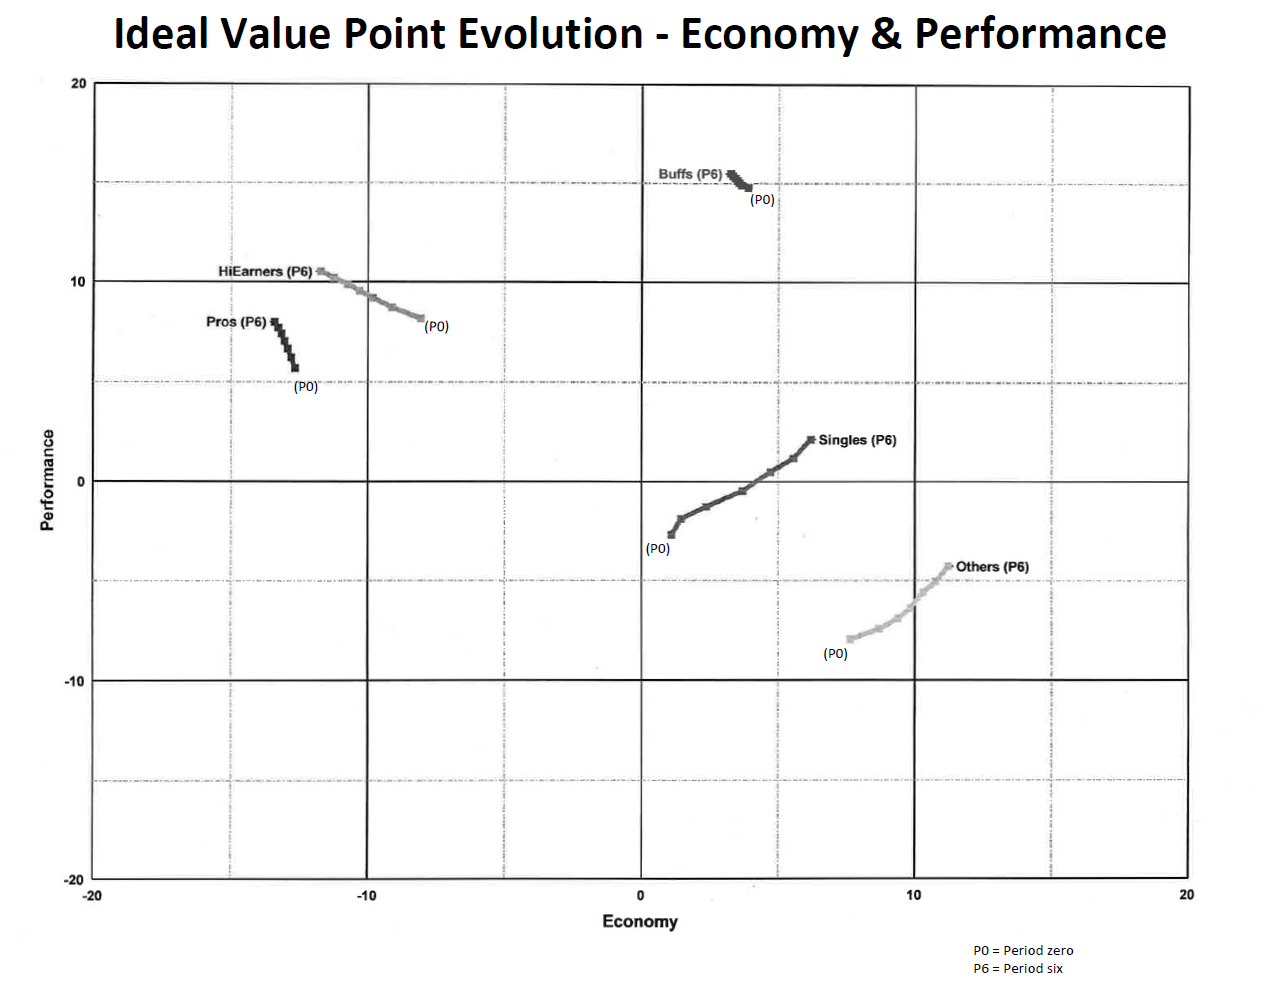
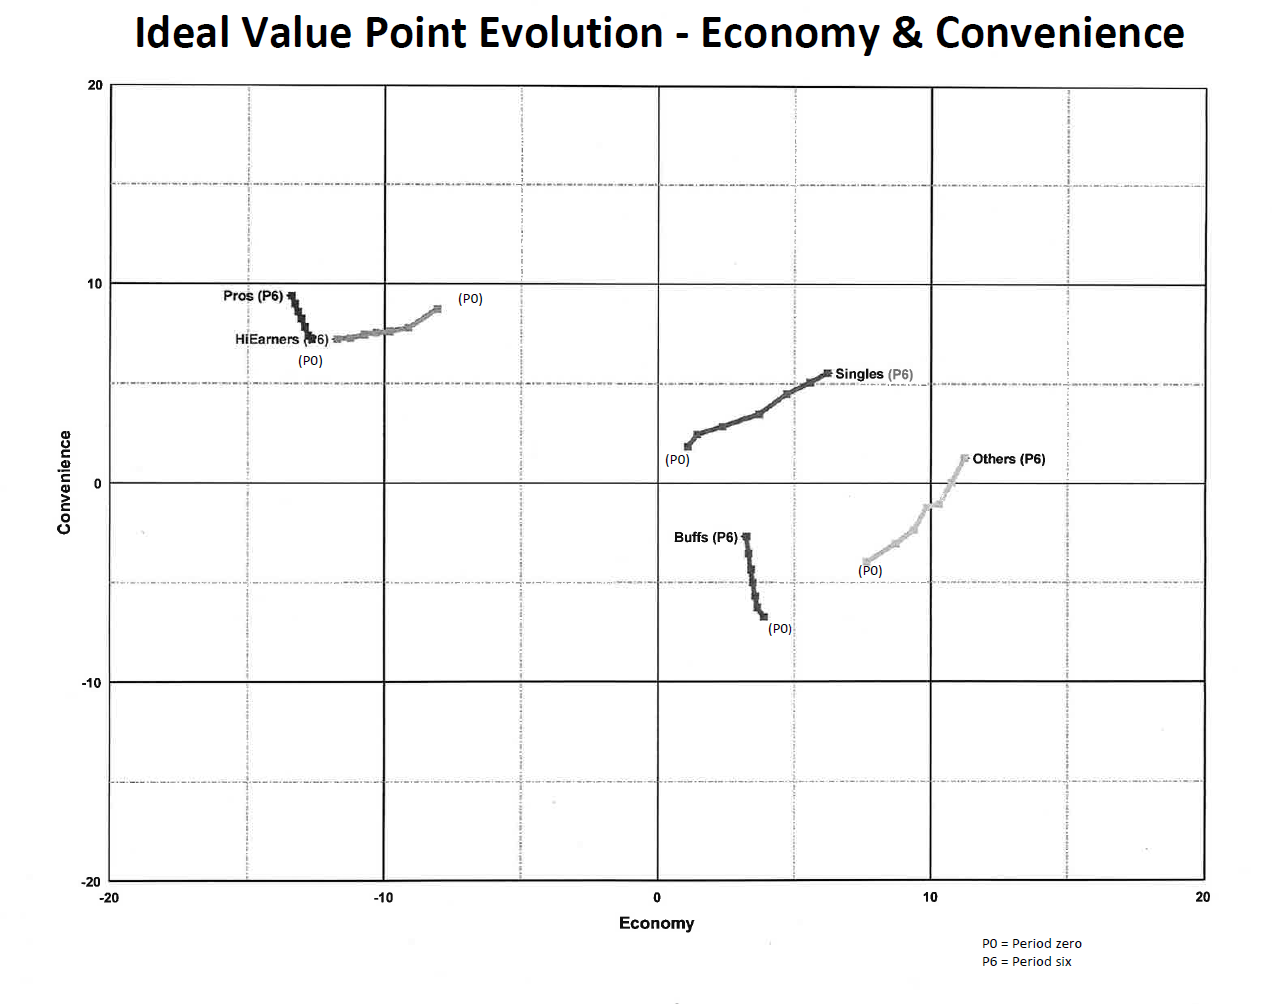
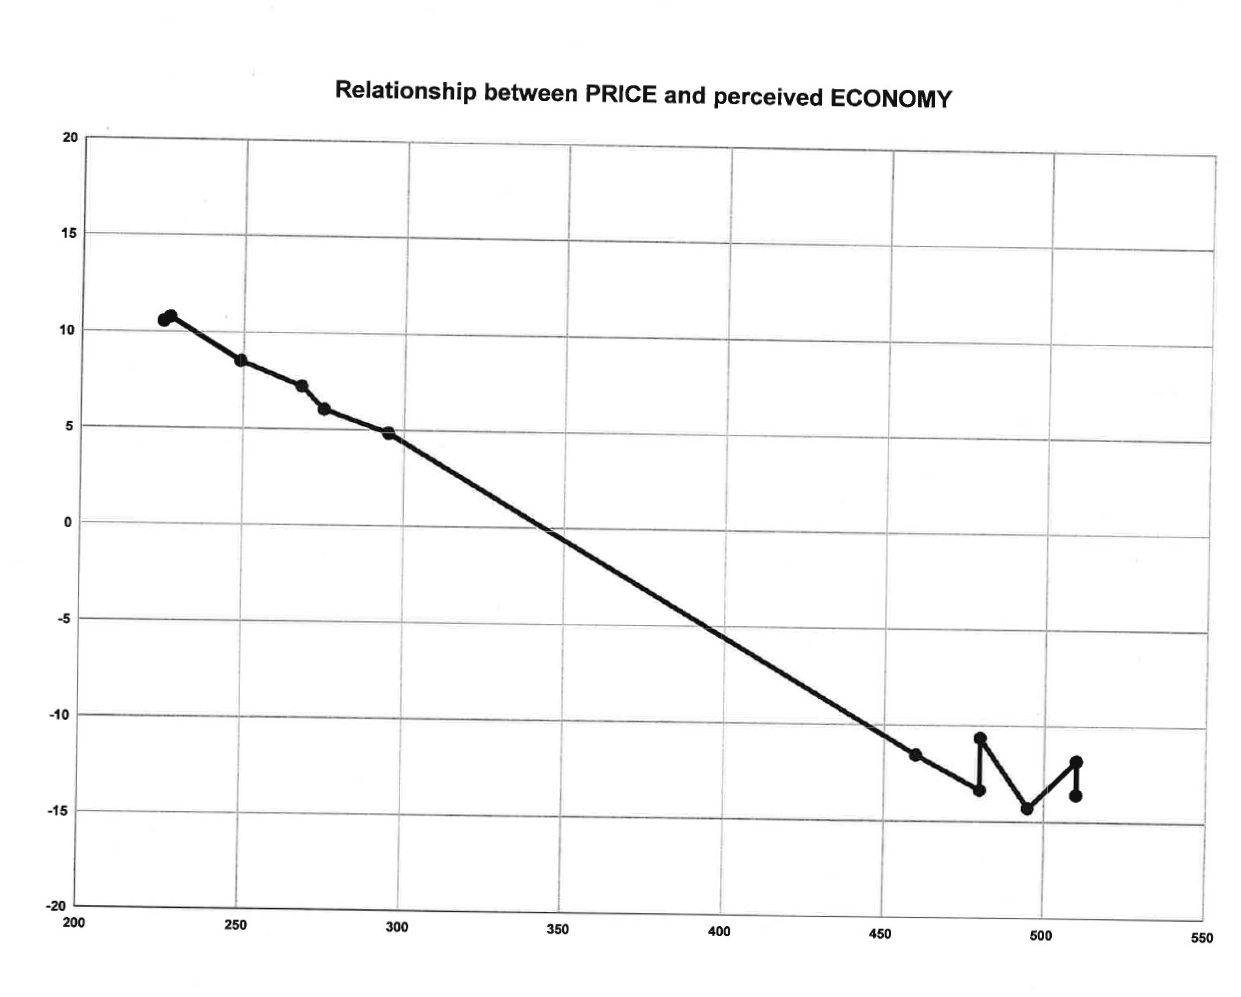
\f\fINDUSTRY PRACTICE - FIRM A PERIOD 6 MULTIDIMENSIONAL SCALING - IDEAL VALUES (-20 TO +20) Segment Economy Performance Convenience Buffs 3.2 15.5 -2.7 Singles 6.2 2.1 5.5 Pros -13.4 8.0 9,4 HiEamers -11.7 10.5 72 Others 11.2 -4.3 1.3\fPerformance Ideal Value Point Evolution - Economy & Performance HiEamem (P6) \"A\". Singles [P61 Economy P0 = Period zero P6 = Period six \fRelationship between PRICE and perceived ECONOMY 20 15 10 5 -5 -10 -15 -20 200 250 300 350 400 450 500 550\f\f\f\f
Step by Step Solution
There are 3 Steps involved in it

Get step-by-step solutions from verified subject matter experts