

Question: Use the Excel file Asset Allocation Data to determine the following: Create a one-way data table that determines the different means and standard deviations for
- Use the Excel file Asset Allocation Data to determine the following:
- Create a one-way data table that determines the different means and standard deviations for combinations of Portfolio 1 and Portfolio 2 by varying the proportion of Portfolio 1.
- Graph the combinations of the portfolios from the one-way data table and add the individual asset means and standard deviations to the graph.
- Using EXCELs Text Box feature, explain why the envelope portfolios may or may not be on the efficient frontier?
- Using Solver or Goal Seek, find an envelope portfolio that would yield an expected return of 5%. What would be the corresponding portfolio standard deviation?
- Using Solver or Goal Seek, find two envelope portfolios that would yield a standard deviation of 7%. What would be the corresponding expected returns for each of these portfolios?
- Using Solver, find the envelope portfolio that would yield the smallest (minimum) standard deviation. What would be the corresponding expected return for this portfolio?
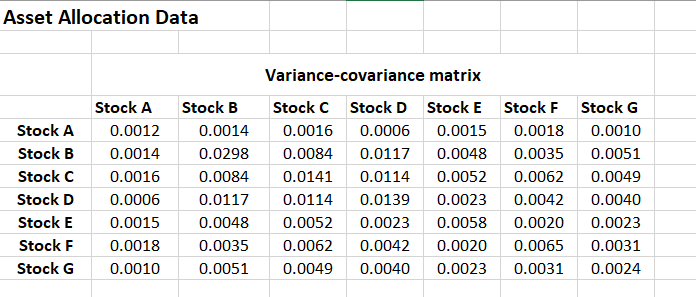
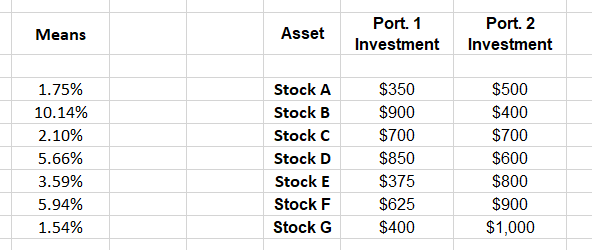
Asset Allocation Data * Stock A Stock B Stock C Stock D Stock E Stock F Stock G Stock A 0.0012 0.0014 0.0016 0.0006 0.0015 0.0018 0.0010 Stock B 0.0014 0.0298 0.0084 0.0117 0.0048 0.0035 0.0051 Variance-covariance matrix Stock C Stock D Stock E Stock F 0.0016 0.0006 0.0015 0.0018 0.0084 0.0117 0.0048 0.0035 0.0141 0.0114 0.0052 0.0062 0.0114 0.0139 0.0023 0.0042 0.0052 0.0023 0.0058 0.0020 0.0062 0.0042 0.0020 0.0065 0.0049 0.0040 0.0023 0.0031 Stock G 0.0010 0.0051 0.0049 0.0040 0.0023 0.0031 0.0024 Means Asset Port. 1 Investment Port. 2 Investment 1.75% 10.14% 2.10% 5.66% 3.59% 5.94% 1.54% Stock A Stock B Stock C Stock D Stock E Stock F Stock G $350 $900 $700 $850 $375 $625 $400 $500 $400 $700 $600 $800 $900 $1,000 Asset Allocation Data * Stock A Stock B Stock C Stock D Stock E Stock F Stock G Stock A 0.0012 0.0014 0.0016 0.0006 0.0015 0.0018 0.0010 Stock B 0.0014 0.0298 0.0084 0.0117 0.0048 0.0035 0.0051 Variance-covariance matrix Stock C Stock D Stock E Stock F 0.0016 0.0006 0.0015 0.0018 0.0084 0.0117 0.0048 0.0035 0.0141 0.0114 0.0052 0.0062 0.0114 0.0139 0.0023 0.0042 0.0052 0.0023 0.0058 0.0020 0.0062 0.0042 0.0020 0.0065 0.0049 0.0040 0.0023 0.0031 Stock G 0.0010 0.0051 0.0049 0.0040 0.0023 0.0031 0.0024 Means Asset Port. 1 Investment Port. 2 Investment 1.75% 10.14% 2.10% 5.66% 3.59% 5.94% 1.54% Stock A Stock B Stock C Stock D Stock E Stock F Stock G $350 $900 $700 $850 $375 $625 $400 $500 $400 $700 $600 $800 $900 $1,000
Step by Step Solution
There are 3 Steps involved in it

Get step-by-step solutions from verified subject matter experts