

Question: Use the Excel output in the below table to do (1) through (6) for each of 89, 81, 62, and 83- V = 6g +
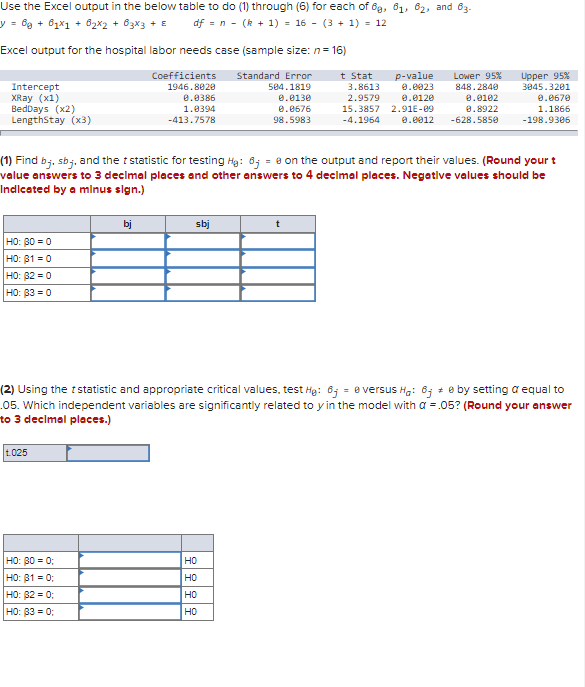
Use the Excel output in the below table to do (1) through (6) for each of 89, 81, 62, and 83- V = 6g + 61x1 + 82x2 + 63X3 + E of = n - (k + 1) = 16 - (3 + 1) = 12 Excel output for the hospital labor needs case (sample size: n = 16) Coefficients Standard Error t Stat p-value Lower 95% Upper 95% Intercept 1946 . 8929 504. 1819 3. 8613 0.2023 848 . 2840 3045. 3201 XRay (x1) 0.0386 2.9579 9. 8120 9.0182 9.9679 BedDays (x2) 1.9394 0. 8676 15. 3857 2.916-29 0. 8922 1.1866 LengthStay (x3) -413. 7578 98 . 5983 -4.1964 9. 2012 -628 . 5850 -198.9386 (1) Find by, sby, and the t statistic for testing My: 6. =e on the output and report their values. (Round your t value answers to 3 decimal places and other answers to 4 decimal places. Negative values should be Indicated by a minus sign.) bj sbj t HO: 80 = 0 HO: 81 = 0 HO: 82 = 0 HO: 83 = 0 (2) Using the c statistic and appropriate critical values, test Me: 6% = e versus Ha: 6% # @ by setting @ equal to 05. Which independent variables are significantly related to y in the model with o =.05? (Round your answer to 3 declmal places.) t.025 HO: 80 = 0; HO HO: 81 = 0; HO HO: 82 = 0; HO HO: 83 = 0; HO
Step by Step Solution
There are 3 Steps involved in it

Get step-by-step solutions from verified subject matter experts