

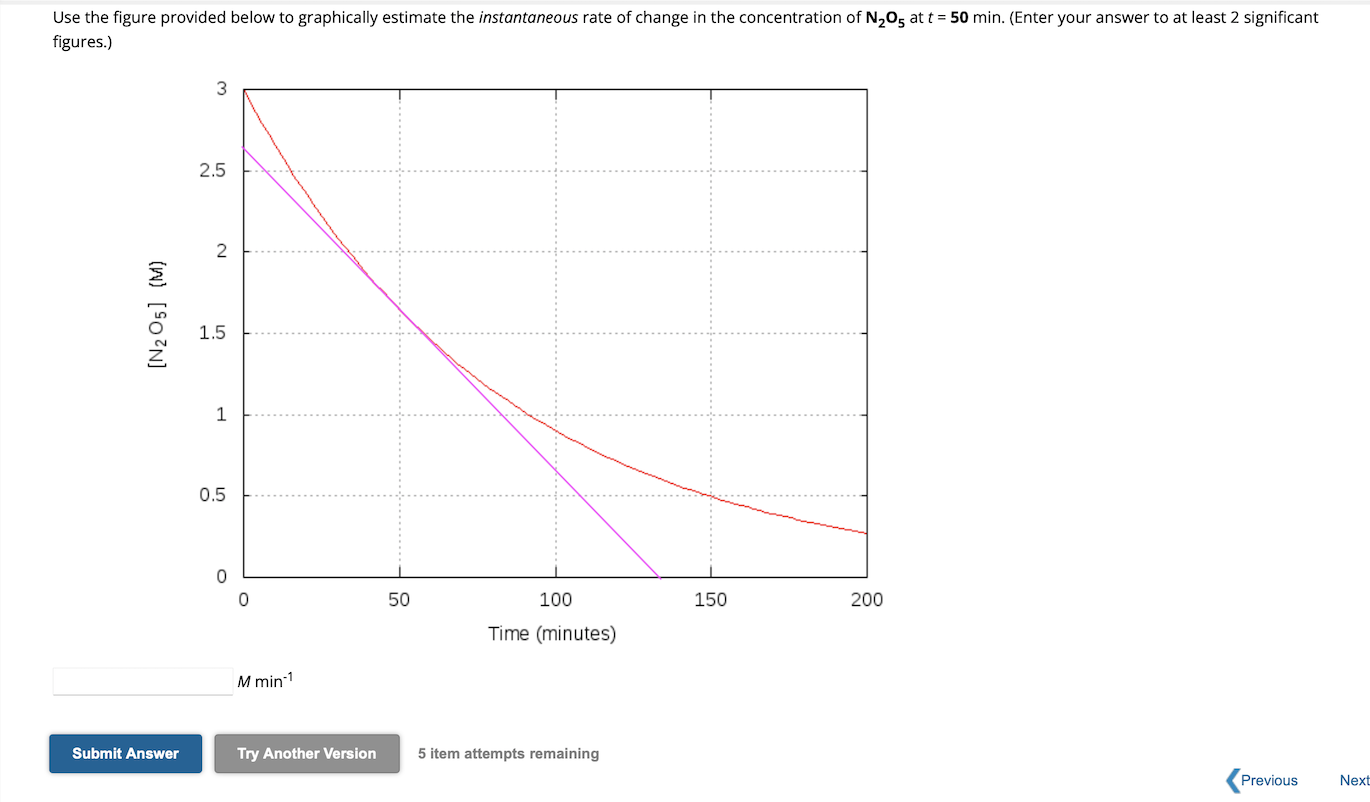
Question: Use the figure provided below to graphically estimate the instantaneous rate of change in the concentration of N 2 O 5 at t = 5
Use the figure provided below to graphically estimate the instantaneous rate of change in the concentration of at min. Enter your answer to at least significant figures.
Mmin
item attempts remaining
Previous
Nex
Step by Step Solution
There are 3 Steps involved in it
1 Expert Approved Answer
Step: 1 Unlock

Question Has Been Solved by an Expert!
Get step-by-step solutions from verified subject matter experts
Step: 2 Unlock
Step: 3 Unlock