

Question: Use the file: Data for Homework Tutorial 4- Forecasting Time Series.xlsx that contains historical sales data during 3 years ( 36 months). The objective is
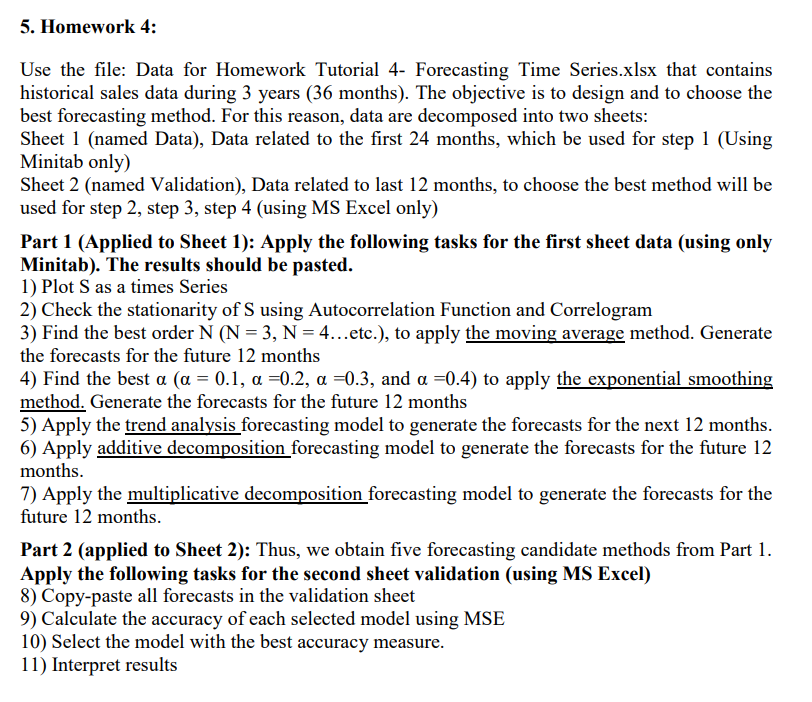
Use the file: Data for Homework Tutorial 4- Forecasting Time Series.xlsx that contains historical sales data during 3 years ( 36 months). The objective is to design and to choose the best forecasting method. For this reason, data are decomposed into two sheets: Sheet 1 (named Data), Data related to the first 24 months, which be used for step 1 (Using Minitab only) Sheet 2 (named Validation), Data related to last 12 months, to choose the best method will be used for step 2, step 3, step 4 (using MS Excel only) Part 1 (Applied to Sheet 1): Apply the following tasks for the first sheet data (using only Minitab). The results should be pasted. 1) Plot S as a times Series 2) Check the stationarity of S using Autocorrelation Function and Correlogram 3) Find the best order N(N=3,N=4 etc. ), to apply the moving average method. Generate the forecasts for the future 12 months 4) Find the best (=0.1,=0.2,=0.3, and =0.4) to apply the exponential smoothing method. Generate the forecasts for the future 12 months 5) Apply the trend analysis forecasting model to generate the forecasts for the next 12 months. 6) Apply additive decomposition forecasting model to generate the forecasts for the future 12 months. 7) Apply the multiplicative decomposition forecasting model to generate the forecasts for the future 12 months. Part 2 (applied to Sheet 2): Thus, we obtain five forecasting candidate methods from Part 1. Apply the following tasks for the second sheet validation (using MS Excel) 8) Copy-paste all forecasts in the validation sheet 9) Calculate the accuracy of each selected model using MSE 10) Select the model with the best accuracy measure. 11) Interpret results
Step by Step Solution
There are 3 Steps involved in it

Get step-by-step solutions from verified subject matter experts