

Question: Use the financial statement data included in the provided Coke vs. Pepsi Data file for the years ended December 31,2018,2019, and 2020 . For Part
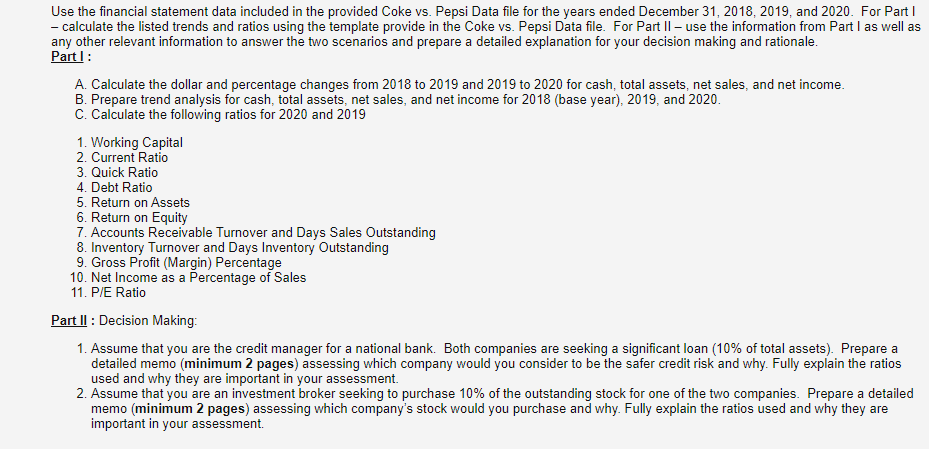
Use the financial statement data included in the provided Coke vs. Pepsi Data file for the years ended December 31,2018,2019, and 2020 . For Part I - calculate the listed trends and ratios using the template provide in the Coke vs. Pepsi Data file. For Part II - use the information from Part I as well as any other relevant information to answer the two scenarios and prepare a detailed explanation for your decision making and rationale. Part I : A. Calculate the dollar and percentage changes from 2018 to 2019 and 2019 to 2020 for cash, total assets, net sales, and net income. B. Prepare trend analysis for cash, total assets, net sales, and net income for 2018 (base year), 2019, and 2020. C. Calculate the following ratios for 2020 and 2019 1. Working Capital 2. Current Ratio 3. Quick Ratio 4. Debt Ratio 5. Return on Assets 6. Return on Equity 7. Accounts Receivable Turnover and Days Sales Outstanding 8. Inventory Turnover and Days Inventory Outstanding 9. Gross Profit (Margin) Percentage 10. Net Income as a Percentage of Sales 11. P/E Ratio Part II : Decision Making: 1. Assume that you are the credit manager for a national bank. Both companies are seeking a significant loan ( 10% of total assets). Prepare a detailed memo (minimum 2 pages) assessing which company would you consider to be the safer credit risk and why. Fully explain the ratios used and why they are important in your assessment. 2. Assume that you are an investment broker seeking to purchase 10% of the outstanding stock for one of the two companies. Prepare a detailed memo (minimum 2 pages) assessing which company's stock would you purchase and why. Fully explain the ratios used and why they are important in your assessment. Use the financial statement data included in the provided Coke vs. Pepsi Data file for the years ended December 31,2018,2019, and 2020 . For Part I - calculate the listed trends and ratios using the template provide in the Coke vs. Pepsi Data file. For Part II - use the information from Part I as well as any other relevant information to answer the two scenarios and prepare a detailed explanation for your decision making and rationale. Part I : A. Calculate the dollar and percentage changes from 2018 to 2019 and 2019 to 2020 for cash, total assets, net sales, and net income. B. Prepare trend analysis for cash, total assets, net sales, and net income for 2018 (base year), 2019, and 2020. C. Calculate the following ratios for 2020 and 2019 1. Working Capital 2. Current Ratio 3. Quick Ratio 4. Debt Ratio 5. Return on Assets 6. Return on Equity 7. Accounts Receivable Turnover and Days Sales Outstanding 8. Inventory Turnover and Days Inventory Outstanding 9. Gross Profit (Margin) Percentage 10. Net Income as a Percentage of Sales 11. P/E Ratio Part II : Decision Making: 1. Assume that you are the credit manager for a national bank. Both companies are seeking a significant loan ( 10% of total assets). Prepare a detailed memo (minimum 2 pages) assessing which company would you consider to be the safer credit risk and why. Fully explain the ratios used and why they are important in your assessment. 2. Assume that you are an investment broker seeking to purchase 10% of the outstanding stock for one of the two companies. Prepare a detailed memo (minimum 2 pages) assessing which company's stock would you purchase and why. Fully explain the ratios used and why they are important in your assessment
Step by Step Solution
There are 3 Steps involved in it

Get step-by-step solutions from verified subject matter experts