

Question: Use the following comparative figures for Apple and Google ints eBook Key Figures Net income (in millions) Apple Google $ 55, 256 Cash dividends declared
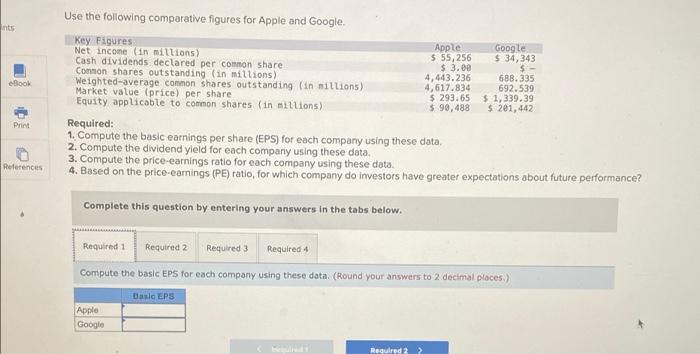
Use the following comparative figures for Apple and Google ints eBook Key Figures Net income (in millions) Apple Google $ 55, 256 Cash dividends declared per common share $ 34, 343 $ 3.00 Common shares outstanding (in millions) $ 4,443.236 688.335 Weighted average common shares outstanding (in millions) Market value (price) per share 4,617.834 692.539 Equity applicable to common shares (in millions) $293.65 $ 1,339.39 $ 90,488 $ 201,442 Required: 1. Compute the basic earnings per share (EPS) for each company using these data. 2. Compute the dividend yield for each company using these data. 3. Compute the price-earnings ratio for each company using these data. 4. Based on the price-earnings (PE) ratio, for which company do investors have greater expectations about future performance? Print References Complete this question by entering your answers in the tabs below. Required 1 Required 2 Required 3 Required 4 Compute the basic EPS for each company using these data. (Round your answers to 2 decimal places) Basla EPS Apple Google Required
Step by Step Solution
There are 3 Steps involved in it

Get step-by-step solutions from verified subject matter experts