

Question: Use the following data chart to solve for the following Selected data from Komar Company follow Balance Sheet As of December 31 2013 2014 $394,000
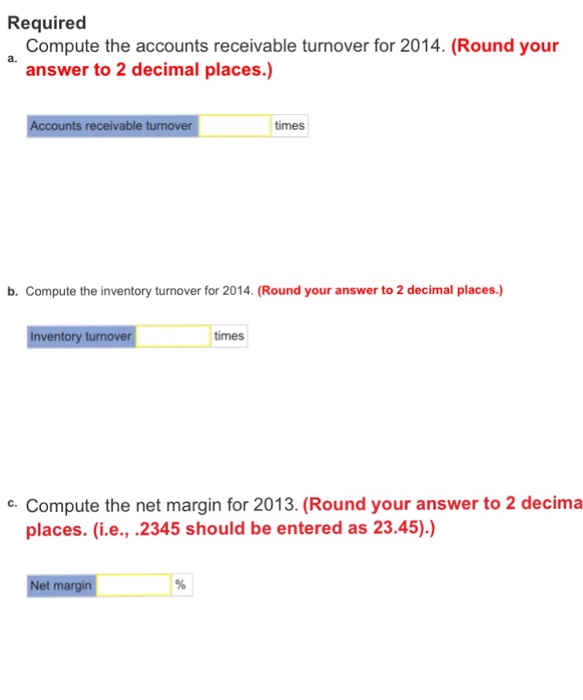
Use the following data chart to solve for the following
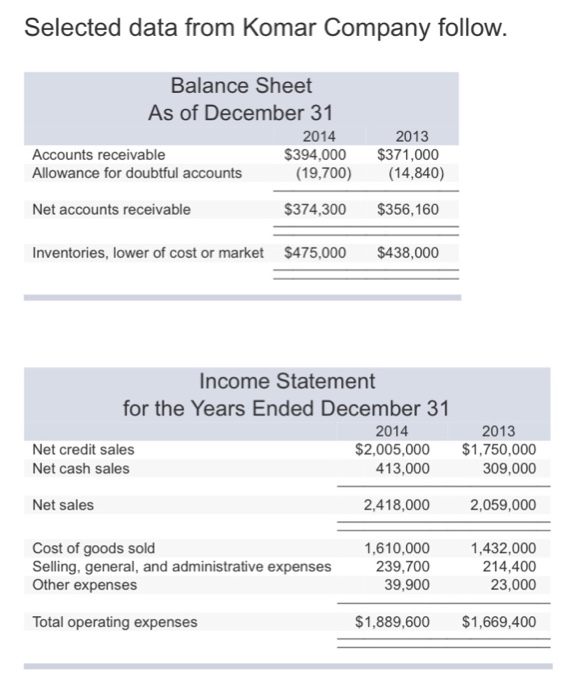
Selected data from Komar Company follow Balance Sheet As of December 31 2013 2014 $394,000 $371,000 Accounts receivable Allowance for doubtful accounts (19,700) (14,840) Net accounts receivable $374,300 $356,160 Inventories, lower of cost or market $475,000 $438,000 Income Statement for the Years Ended December 31 2014 2013 Net credit sales $2,005,000 $1,750,000 Net cash sales 413,000 309,000 Net sales 2,418,000 2,059,000 1,610,000 1,432,000 Cost of goods sold Selling, general, and administrative expenses 239,700 214,400 Other expenses 39,900 23,000 Total operating expenses $1,889,600 $1,669,400
Step by Step Solution
There are 3 Steps involved in it
1 Expert Approved Answer
Step: 1 Unlock

Question Has Been Solved by an Expert!
Get step-by-step solutions from verified subject matter experts
Step: 2 Unlock
Step: 3 Unlock