

Question: Use the following data to compute the statistics below. Point values are provided for each part. Questions / Problems: C Calculate the expected return, variance,
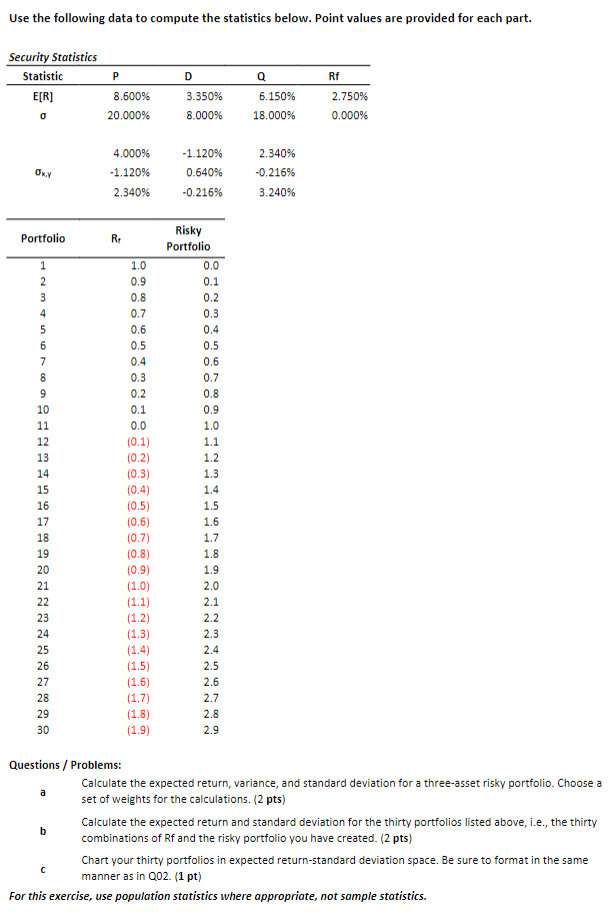
Use the following data to compute the statistics below. Point values are provided for each part. Questions / Problems: C Calculate the expected return, variance, and standard deviation for a three-asset risky portfolio. Choose a set of weights for the calculations. (2 pts) set of weights for the calculations. (2 pts) b Calculate the expected return and standard deviation for the thirty portfolios listed above, i.e., the thirty combinations of Rf and the risky portfolio you have created. (2 pts) c Chart your thirty portfolios in expected return-standard deviation space. Be sure to format in the same manner as in Q02. (1 pt) For this exercise, use population statistics where appropriate, not sample statistics. Use the following data to compute the statistics below. Point values are provided for each part. Questions / Problems: C Calculate the expected return, variance, and standard deviation for a three-asset risky portfolio. Choose a set of weights for the calculations. (2 pts) set of weights for the calculations. (2 pts) b Calculate the expected return and standard deviation for the thirty portfolios listed above, i.e., the thirty combinations of Rf and the risky portfolio you have created. (2 pts) c Chart your thirty portfolios in expected return-standard deviation space. Be sure to format in the same manner as in Q02. (1 pt) For this exercise, use population statistics where appropriate, not sample statistics
Step by Step Solution
There are 3 Steps involved in it

Get step-by-step solutions from verified subject matter experts