

Question: Use the following data to compute the statistics below. Point values are provided for each part. Questions / Problems: Calculate portfolio expected return and standard
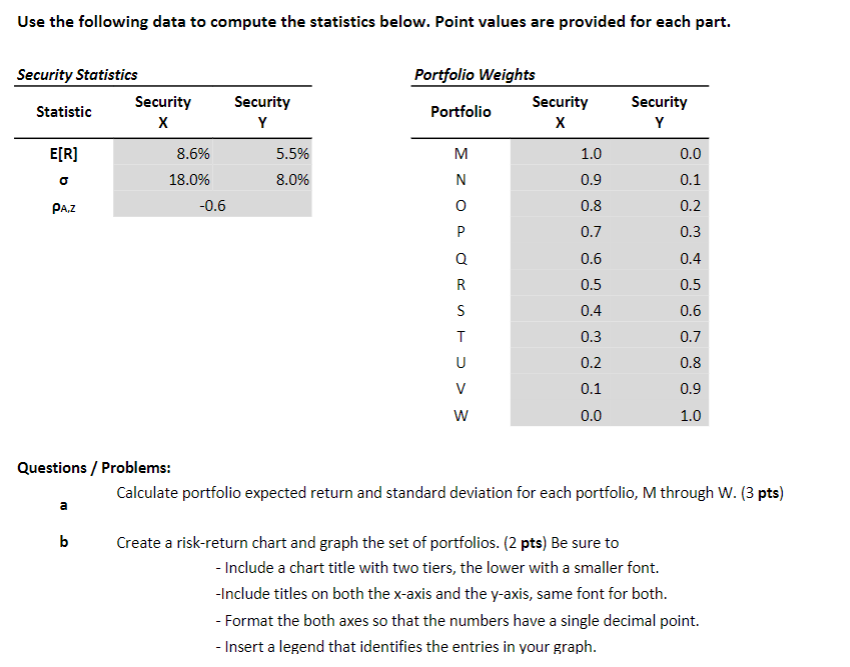
Use the following data to compute the statistics below. Point values are provided for each part. Questions / Problems: Calculate portfolio expected return and standard deviation for each portfolio, M through W. (3 pts) b Create a risk-return chart and graph the set of portfolios. (2 pts) Be sure to - Include a chart title with two tiers, the lower with a smaller font. -Include titles on both the x-axis and the y-axis, same font for both. - Format the both axes so that the numbers have a single decimal point. - Insert a legend that identifies the entries in your graph. Use the following data to compute the statistics below. Point values are provided for each part. Questions / Problems: Calculate portfolio expected return and standard deviation for each portfolio, M through W. (3 pts) b Create a risk-return chart and graph the set of portfolios. (2 pts) Be sure to - Include a chart title with two tiers, the lower with a smaller font. -Include titles on both the x-axis and the y-axis, same font for both. - Format the both axes so that the numbers have a single decimal point. - Insert a legend that identifies the entries in your graph
Step by Step Solution
There are 3 Steps involved in it

Get step-by-step solutions from verified subject matter experts