

Question: Use the following gas composition vs temperature data to construct the ln(k) vs 1/T plot. b) Based on your plot, calculate the enthalpy and entropy
Use the following gas composition vs temperature data to construct the ln(k) vs 1/T plot.
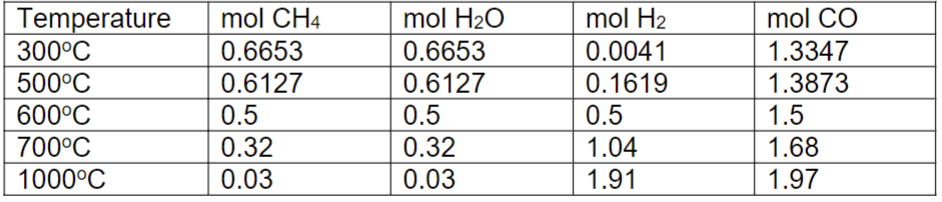
b) Based on your plot, calculate the enthalpy and entropy of the chemical reaction. c) At what temperature would the direction of spontaneity change?
\begin{tabular}{|l|l|l|l|l|} \hline Temperature & molCH4 & molH2O & molH2 & molCO \\ \hline 300C & 0.6653 & 0.6653 & 0.0041 & 1.3347 \\ \hline 500C & 0.6127 & 0.6127 & 0.1619 & 1.3873 \\ \hline 600C & 0.5 & 0.5 & 0.5 & 1.5 \\ \hline 700C & 0.32 & 0.32 & 1.04 & 1.68 \\ \hline 1000C & 0.03 & 0.03 & 1.91 & 1.97 \\ \hline \end{tabular}
Step by Step Solution
There are 3 Steps involved in it
1 Expert Approved Answer
Step: 1 Unlock

Question Has Been Solved by an Expert!
Get step-by-step solutions from verified subject matter experts
Step: 2 Unlock
Step: 3 Unlock