

Question: Use the following graph to answer the questions below: Dollars 140 120 100 80 60 40 20 50 100 150 200 250 300 350 Textbooks

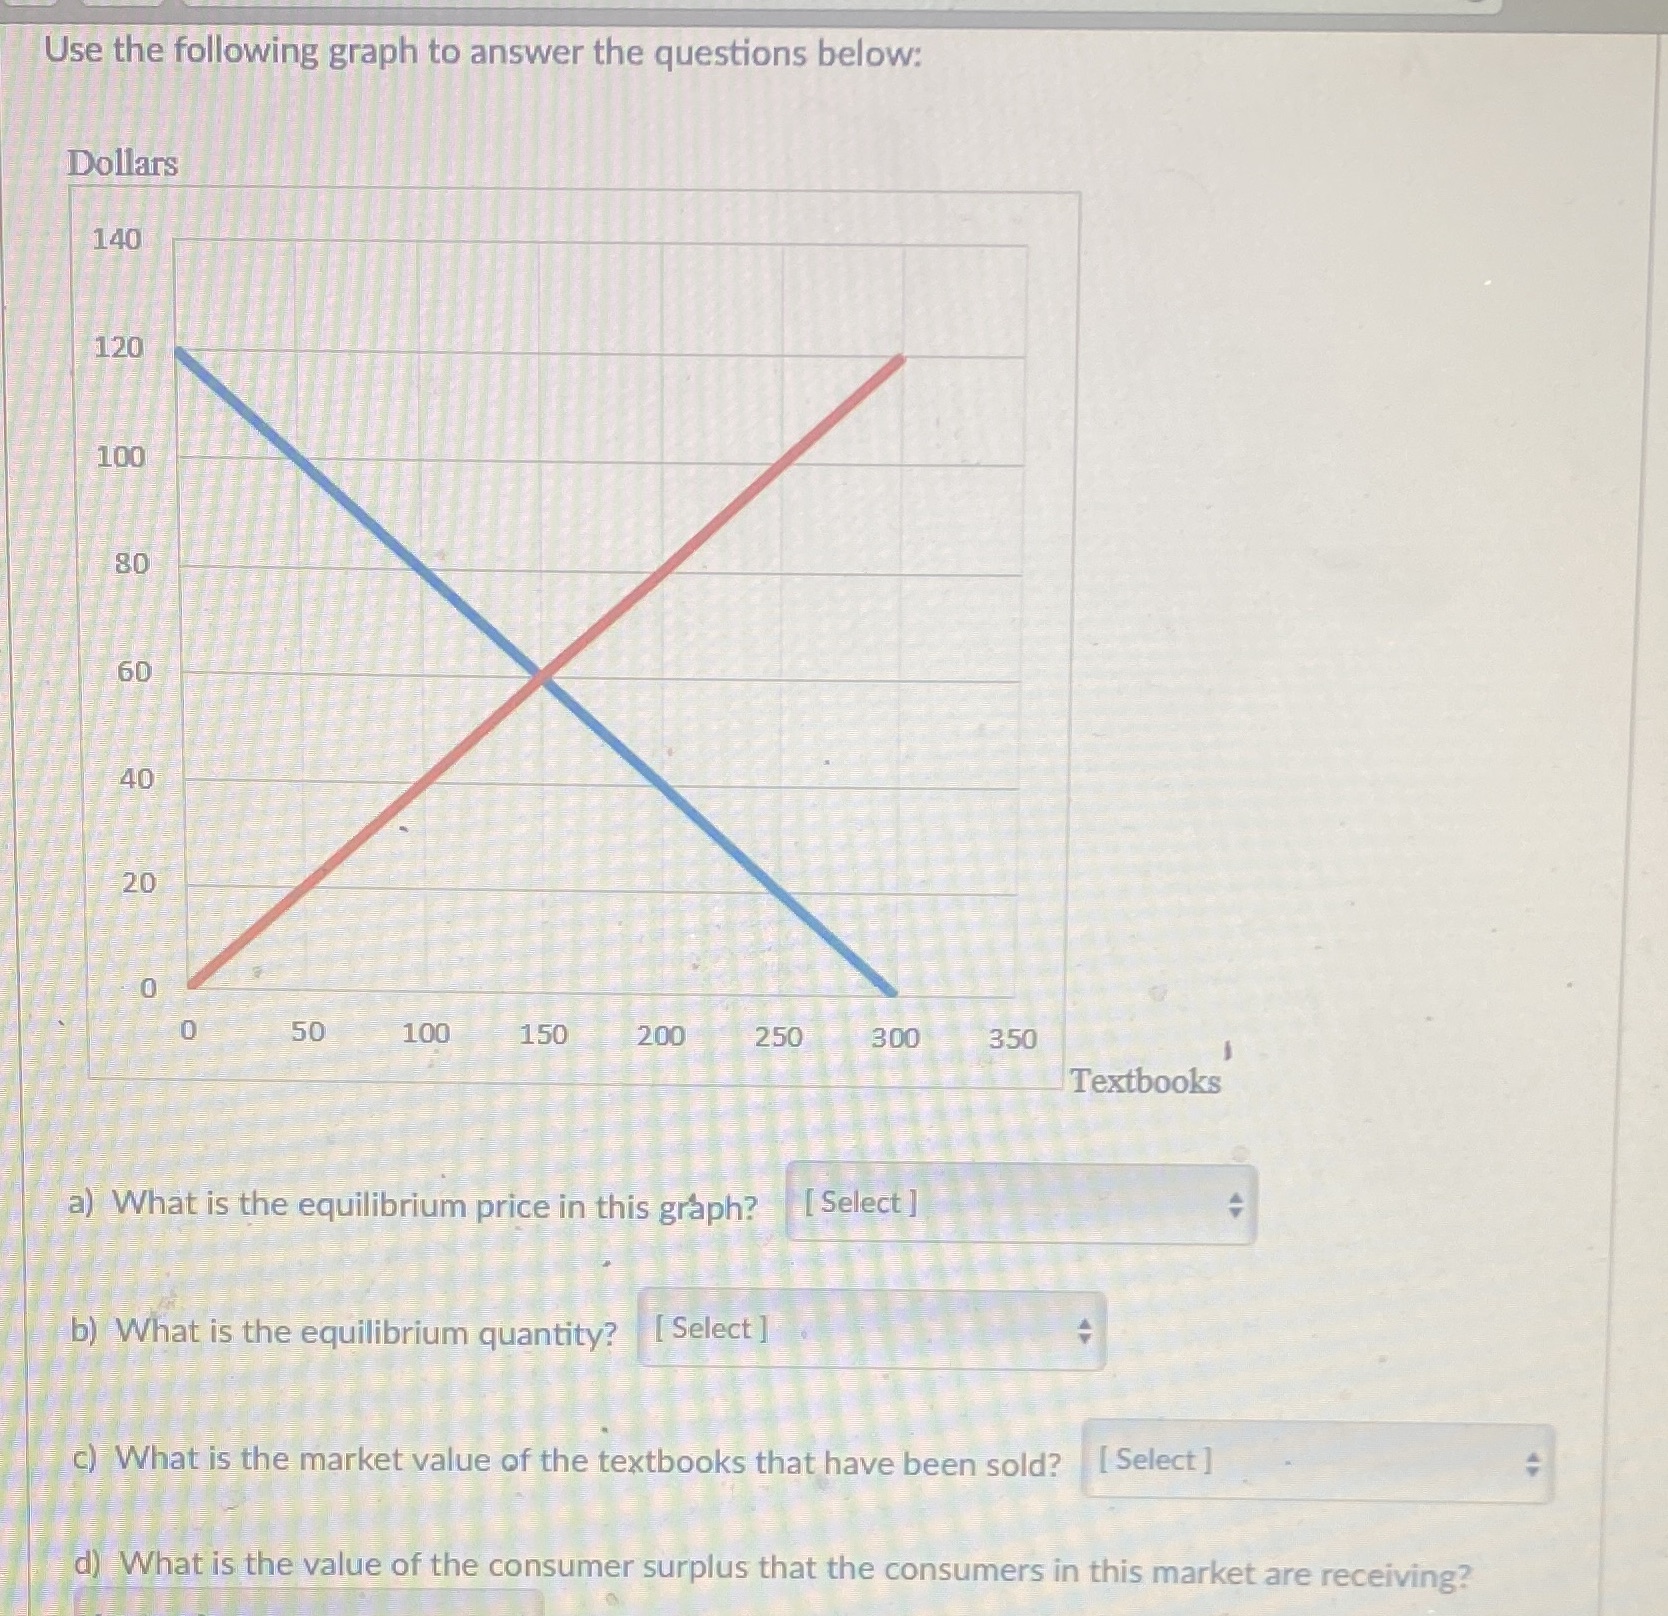
Use the following graph to answer the questions below: Dollars 140 120 100 80 60 40 20 50 100 150 200 250 300 350 Textbooks a) What is the equilibrium price in this graph? [ Select ] b) What is the equilibrium quantity? [ Select ] c) What is the market value of the textbooks that have been sold? [ Select ] d) What is the value of the consumer surplus that the consumers in this market are receiving
Step by Step Solution
There are 3 Steps involved in it
1 Expert Approved Answer
Step: 1 Unlock

Question Has Been Solved by an Expert!
Get step-by-step solutions from verified subject matter experts
Step: 2 Unlock
Step: 3 Unlock