

Question: Use the following image as ar refernce to do steps below Step 2 : ( Compare six SVM classifiers with polynomial kernel ( kernel =
Use the following image as ar refernce to do steps below Step : Compare six SVM classifiers with polynomial kernel kernel'poly' degrees and gamma values by drawing a grid of six plots similar to the one you obtained from step Step : Compare the following six classifiers by drawing a grid of six plots similar to the one you obtained from step :
linear regression
linearSVC
GaussianNB w varsmoothinge
GaussianNB w varsmoothinge
GaussianNB w varsmoothinge
GaussianNB w varsmoothinge
Step : Compare six variations of SVM classifiers with kernels sigmoidrfb and gamma values eee by drawing a grid of six plots similar to the one you obtained from step
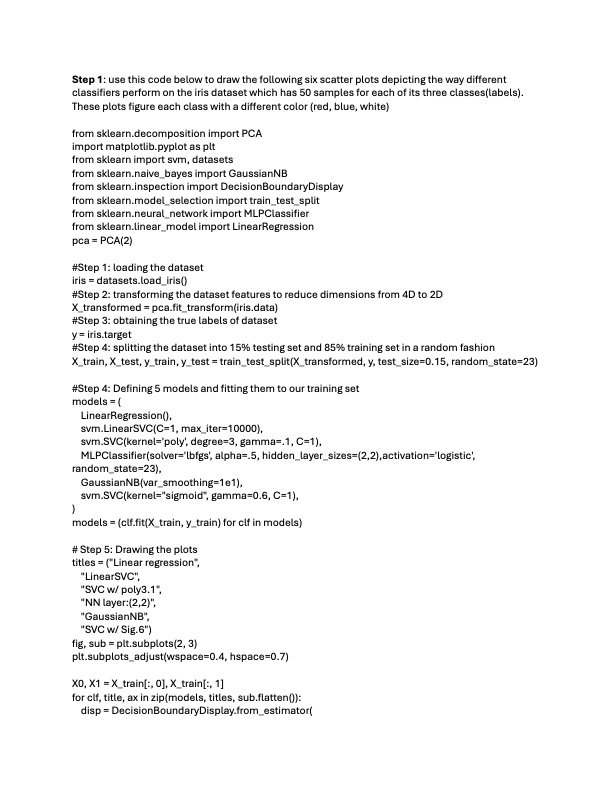
Step : Compare eight variations of neural network MLP classifiers with default alpha e solvers adamlbfgs activation logistic 'relu' and layers by drawing a grid of eight plots similar to the one you obtained from step Step : use this code below to draw the following six scatter plots depicting the way different
classifiers perform on the iris dataset which has samples for each of its three classeslabels
These plots figure each class with a different color red blue, white
#Step : loading the dataset
iris datasets.loadiris
#Step : transforming the dataset features to reduce dimensions from to
Xtransformed pca.fittransformirisdata
#Step : obtaining the true labels of dataset
iris.target
#Step : splitting the dataset into testing set and training set in a random fashion
Xtrain, Xtest, test traintestsplit testsize randomstate
#Step : Defining models and fitting them to our training set
models
LinearRegression
svmLinearSVC maxiter
svmSVCkernel'poly', degree gamma C
MLPClassifiersolverlbfgs alpha hiddenlayersizes activation'logistic',
randomstate
GaussianNBvarsmoothinge
svmSVCkernel"sigmoid", gamma C
# Step : Drawing the plots
titles Linear regression",
"LinearSVC",
SVC W poly
NN layer:
"GaussianNB",
SVC w Sig
fig, sub pltsubplots
pltsubplotsadjustwspace hspace
train: Xtrain :
for clf title, ax in zipmodels titles, sub.flatten:
disp DecisionBoundaryDisplay.fromestimator
Step by Step Solution
There are 3 Steps involved in it
1 Expert Approved Answer
Step: 1 Unlock

Question Has Been Solved by an Expert!
Get step-by-step solutions from verified subject matter experts
Step: 2 Unlock
Step: 3 Unlock