

Question: Use the following information from a multiple regression analysis to complete parts (a) through (c) below. n= 25 b, =15 b2 =20 Sp, =4 Spy
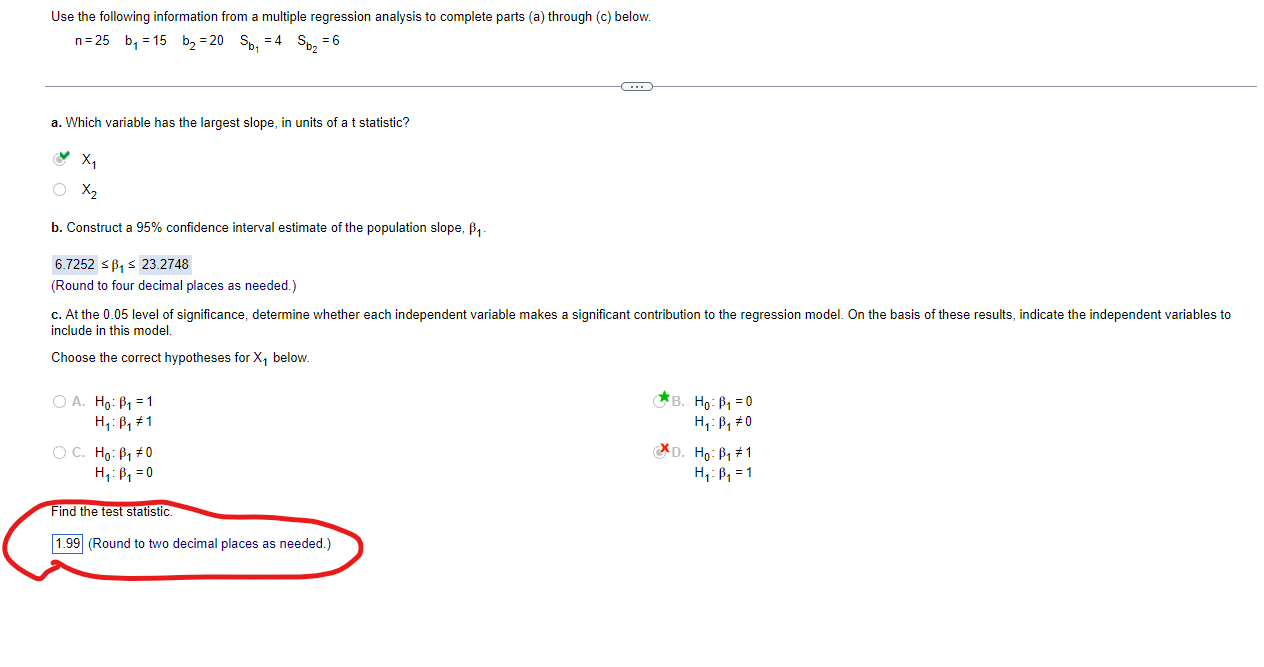
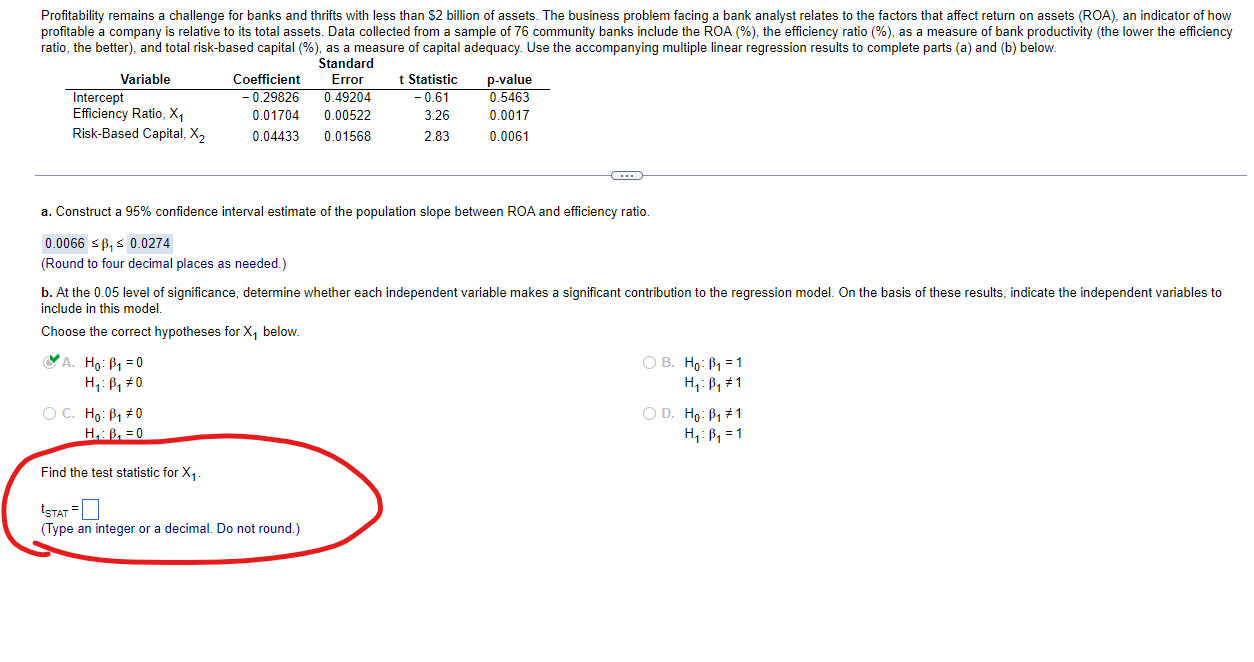
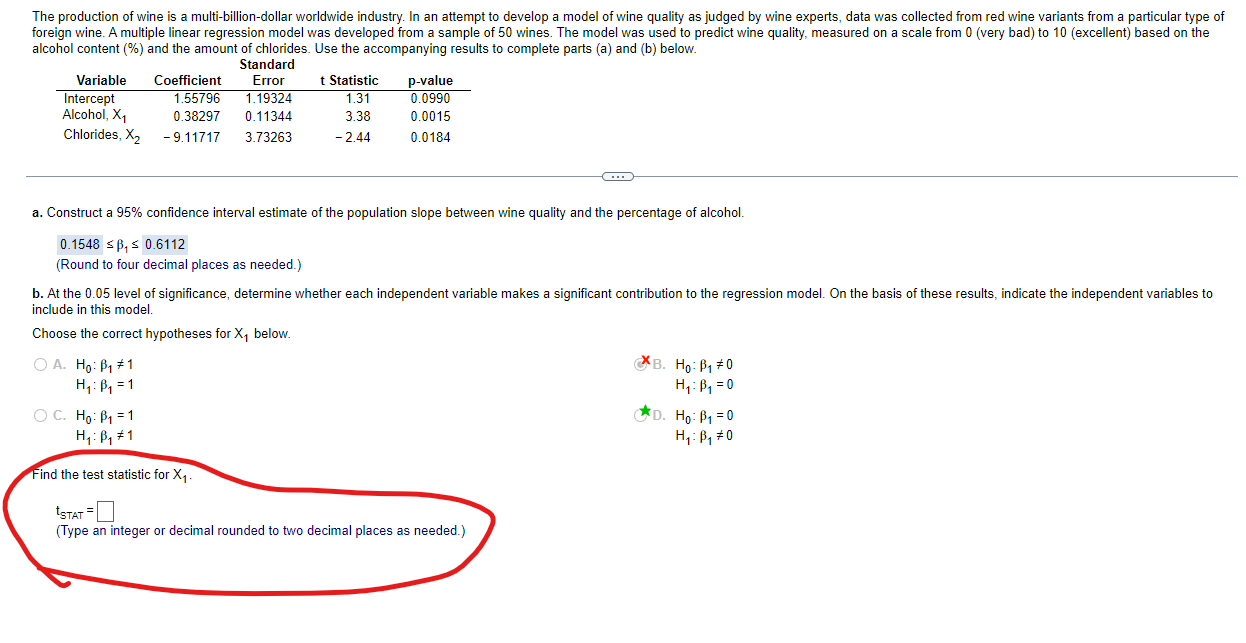
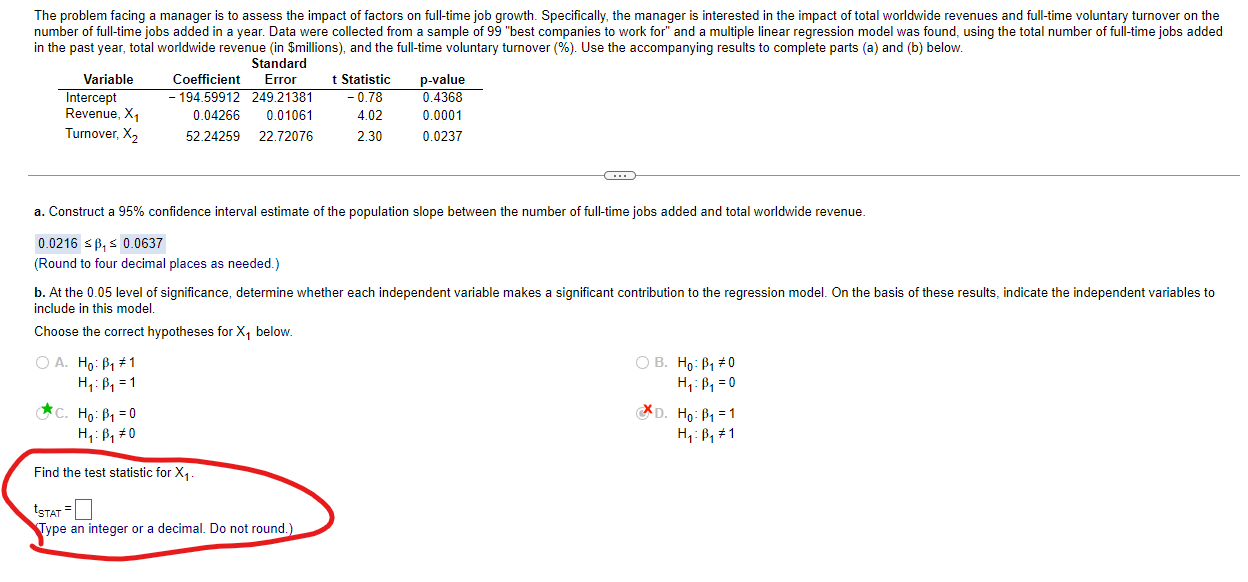
Use the following information from a multiple regression analysis to complete parts (a) through (c) below. n= 25 b, =15 b2 =20 Sp, =4 Spy =6 a. Which variable has the largest slope, in units of a t statistic? O XZ b. Construct a 95% confidence interval estimate of the population slope, B1 - 6.7252 sB, $ 23.2748 (Round to four decimal places as needed.) c. At the 0.05 level of significance, determine whether each independent variable makes a significant contribution to the regression model. On the basis of these results, indicate the independent variables to include in this model. Choose the correct hypotheses for X, below. O A. Ho: P1 = 1 *B. Ho: B1 = 0 Hy : By # 1 OC. Ho: B1 # 0 XD. Ho: B1 # 1 H : B1 =0 Hy : By = 1 Find the test statistic. 1.99 (Round to two decimal places as needed.)Profitability remains a challenge for banks and thrifts with less than $2 billion of assets. The business problem facing a bank analyst relates to the factors that affect return on assets (ROA), an indicator of how profitable a company is relative to its total assets. Data collected from a sample of 76 community banks include the ROA (%), the efficiency ratio (%), as a measure of bank productivity (the lower the efficiency ratio, the better), and total risk-based capital (%), as a measure of capital adequacy. Use the accompanying multiple linear regression results to complete parts (a) and (b) below. Standard Variable Coefficient Error t Statistic p-value Intercept - 0.29826 0.49204 - 0.61 0.5463 Efficiency Ratio, X1 0.01704 0.00522 3.26 0.0017 Risk-Based Capital, X2 0.04433 0.01568 2.83 0.0061 a. Construct a 95% confidence interval estimate of the population slope between ROA and efficiency ratio. 0.0066 sp, 5 0.0274 (Round to four decimal places as needed.) b. At the 0.05 level of significance, determine whether each independent variable makes a significant contribution to the regression model. On the basis of these results, indicate the independent variables to include in this model. Choose the correct hypotheses for X1 below. YA. Ho: P1 = 0 OB. Ho: By = 1 Hy : B1 $ 0 Hy : By # 1 OC. Ho: By # 0 OD. Ho: By # 1 H , : B, =0 Hy : By = 1 Find the test statistic for X1 . STAT = (Type an integer or a decimal. Do not round.)The production of wine is a multi-billion-dollar worldwide industry. In an attempt to develop a model of wine quality as judged by wine experts, data was collected from red wine variants from a particular type of foreign wine. A multiple linear regression model was developed from a sample of 50 wines. The model was used to predict wine quality, measured on a scale from 0 (very bad) to 10 (excellent) based on the alcohol content (%) and the amount of chlorides. Use the accompanying results to complete parts (a) and (b) below. Standard Variable Coefficient Error t Statistic p-value Intercept 1.55796 1.19324 1.31 0.0990 Alcohol, X1 0.38297 0.11344 3.38 0.0015 Chlorides, X2 -9.11717 3.73263 - 2.44 0.0184 a. Construct a 95% confidence interval estimate of the population slope between wine quality and the percentage of alcohol. 0.1548 sp. = 0.6112 (Round to four decimal places as needed.) b. At the 0.05 level of significance, determine whether each independent variable makes a significant contribution to the regression model. On the basis of these results, indicate the independent variables to include in this model. Choose the correct hypotheses for X, below. OA. Ho: B1 # 1 XB. Ho: 1 70 Hy : By = 1 Hy : By =0 O C. Ho: B1 = 1 *D. Ho: B1 = 0 Hy: By # 1 Find the test statistic for X1 . STAT = (Type an integer or decimal rounded to two decimal places as needed.)The problem facing a manager is to assess the impact of factors on full-time job growth. Specifically, the manager is interested in the impact of total worldwide revenues and full-time voluntary turnover on the number of full-time jobs added in a year. Data were collected from a sample of 99 "best companies to work for" and a multiple linear regression model was found, using the total number of full-time jobs added in the past year, total worldwide revenue (in $millions), and the full-time voluntary turnover (%). Use the accompanying results to complete parts (a) and (b) below. Standard Variable Coefficient Error t Statistic p-value Intercept - 194.59912 249.21381 - 0.78 0.4368 Revenue, X1 0.04266 0.01061 4.02 0.0001 Turnover, Xz 52.24259 22.72076 2.30 0.0237 a. Construct a 95% confidence interval estimate of the population slope between the number of full-time jobs added and total worldwide revenue. 0.0216 s p, 5 0.0637 (Round to four decimal places as needed.) b. At the 0.05 level of significance, determine whether each independent variable makes a significant contribution to the regression model. On the basis of these results, indicate the independent variables to include in this model. Choose the correct hypotheses for X, below. O A. Ho: 1 # 1 OB. Ho: By # 0 Hy : By = 1 Hy : By =0 *C. Ho: P1 = 0 XD. Ho: B1 = 1 Hy : B, $ 0 Hy : By # 1 Find the test statistic for X1 . STAT = Type an integer or a decimal. Do not round
Step by Step Solution
There are 3 Steps involved in it

Get step-by-step solutions from verified subject matter experts