

Question: Use the following research description and corresponding data set to perform the activities given in A-C. Provide steps to find the data using JMP. Data:
Use the following research description and corresponding data set to perform the activities given in A-C. Provide steps to find the data using JMP.
Data:
| Year 1 | Year 5 |
| 10 | 19 |
| 14 | 27 |
| 16 | 19 |
| 13 | 15 |
| 16 | 22 |
| 16 | 16 |
| 13 | 12 |
| 13 | 18 |
| 15 | 15 |
| 17 | 18 |
| 10 | 14 |
| 9 | 19 |
| 18 | 19 |
| 19 | 16 |
| 8 | 22 |
| 8 | 15 |
| 17 | 13 |
| 10 | 14 |
| 20 | 18 |
| 18 | 21 |
| 17 | 16 |
| 19 | 10 |
| 16 | 10 |
| 11 | 20 |
| 19 | 15 |
| 11 | 18 |
| 20 | 14 |
| 16 | 17 |
| 17 | 15 |
| 7 | 13 |
| 15 | 13 |
| 18 | 11 |
| 22 | 18 |
| 13 | 19 |
| 8 | 12 |
| 17 | 17 |
| 13 | 19 |
| 16 | 17 |
| 16 | 20 |
| 16 | 16 |
| 21 | 18 |
| 16 | 18 |
| 13 | 21 |
| 14 | 12 |
| 19 | 19 |
| 14 | 13 |
| 14 | 15 |
| 11 | 17 |
| 24 | 15 |
| 9 | 14 |
| 16 | 12 |
| 17 | 14 |
| 13 | 18 |
| 11 | 18 |
| 14 | 16 |
| 8 | 15 |
| 16 | 18 |
| 16 | 14 |
| 17 | 15 |
| 12 | 13 |
| 18 | 16 |
| 17 | 16 |
| 22 | 15 |
| 12 | 14 |
| 12 | 17 |
| 17 | 17 |
| 17 | 21 |
| 15 | 20 |
| 13 | 17 |
| 14 | 24 |
| 24 | 22 |
| 11 | 19 |
| 15 | 16 |
| 15 | 17 |
| 17 | 13 |
| 18 | 16 |
| 20 | 22 |
| 20 | 16 |
| 15 | 20 |
| 18 | 14 |
| 14 | 17 |
| 16 | 16 |
| 16 | 15 |
| 16 | 18 |
| 14 | 21 |
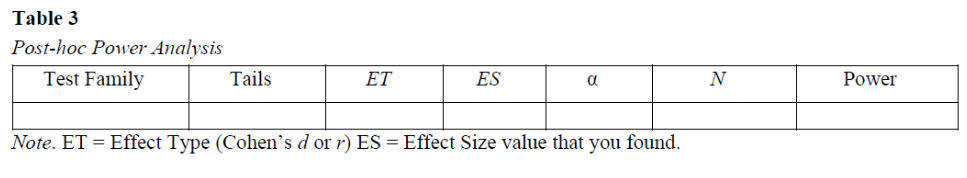
Consider a hypothetical research study inspired by Dunbar (2015), who examined factors that contributed to flight instructor complacency. For the current study, though, the objective is to examine the effect CFIs' acquired experience has on complacency. In the data below, there are two sets of data. The first set was collected from a volunteer group of first-year CFIs, and the second set was collected from the same group of CFIs 5 years later to see if their tendency toward complacency as a flight instructor changed as a result of the experience they gained over the past 5 years. Complacency scores were measured on an 8-item Likert scale ranging from 1 = Strongly Disagree to 5 = Strongly Agree. Thus, scores could range from 8 to 40, with higher scores indicating a higher tendency toward complacency as a flight instructor. A. Pre-Data Analysis 1. Specify the research question 2. Specify the research hypothesis. 3. Determine the appropriate research methodology/design and explain why it is appropriate. 4. Conduct an a priori power analysis to determine the minimum sample size needed. Compare this result to the size of the given data set and explain what impact the size of the given sample will have on the results relative to the minimum size needed. (In order to answer this question, please fill out the below table with the parameters asked).
A priori power analysis
| Test family | Tails | ET | ES | ? | N* | Actual N |
Note: ET. Effect Type (Cohen's d or r) ES: effect size value that you want to go with.
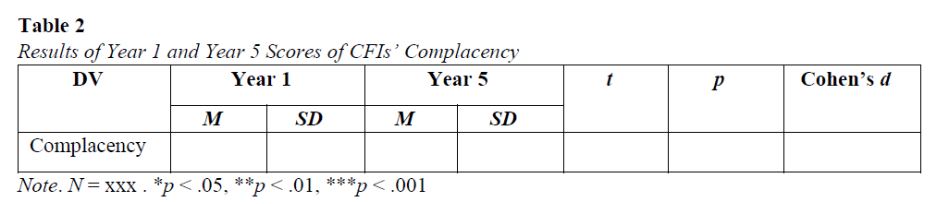
B. Data Analysis Analyze the given data set relative to a hypothesis test of the difference in two group means as presented in Section 11.4. Step 1: Formulate Hypotheses Step 2: Test Criteria (Test Statistic, Significance Level, df, Critical Value) Step 3: Check Assumptions (Independence and Normality) and Conduct Analysis Step 4: Make A Decision (Whether you reject or fail to reject based on computed value) and Concluding Statement(Interpret the results - this has to be done in a similar format that has been provided in guided example and also fill out the table below)
Step by Step Solution
There are 3 Steps involved in it

Get step-by-step solutions from verified subject matter experts