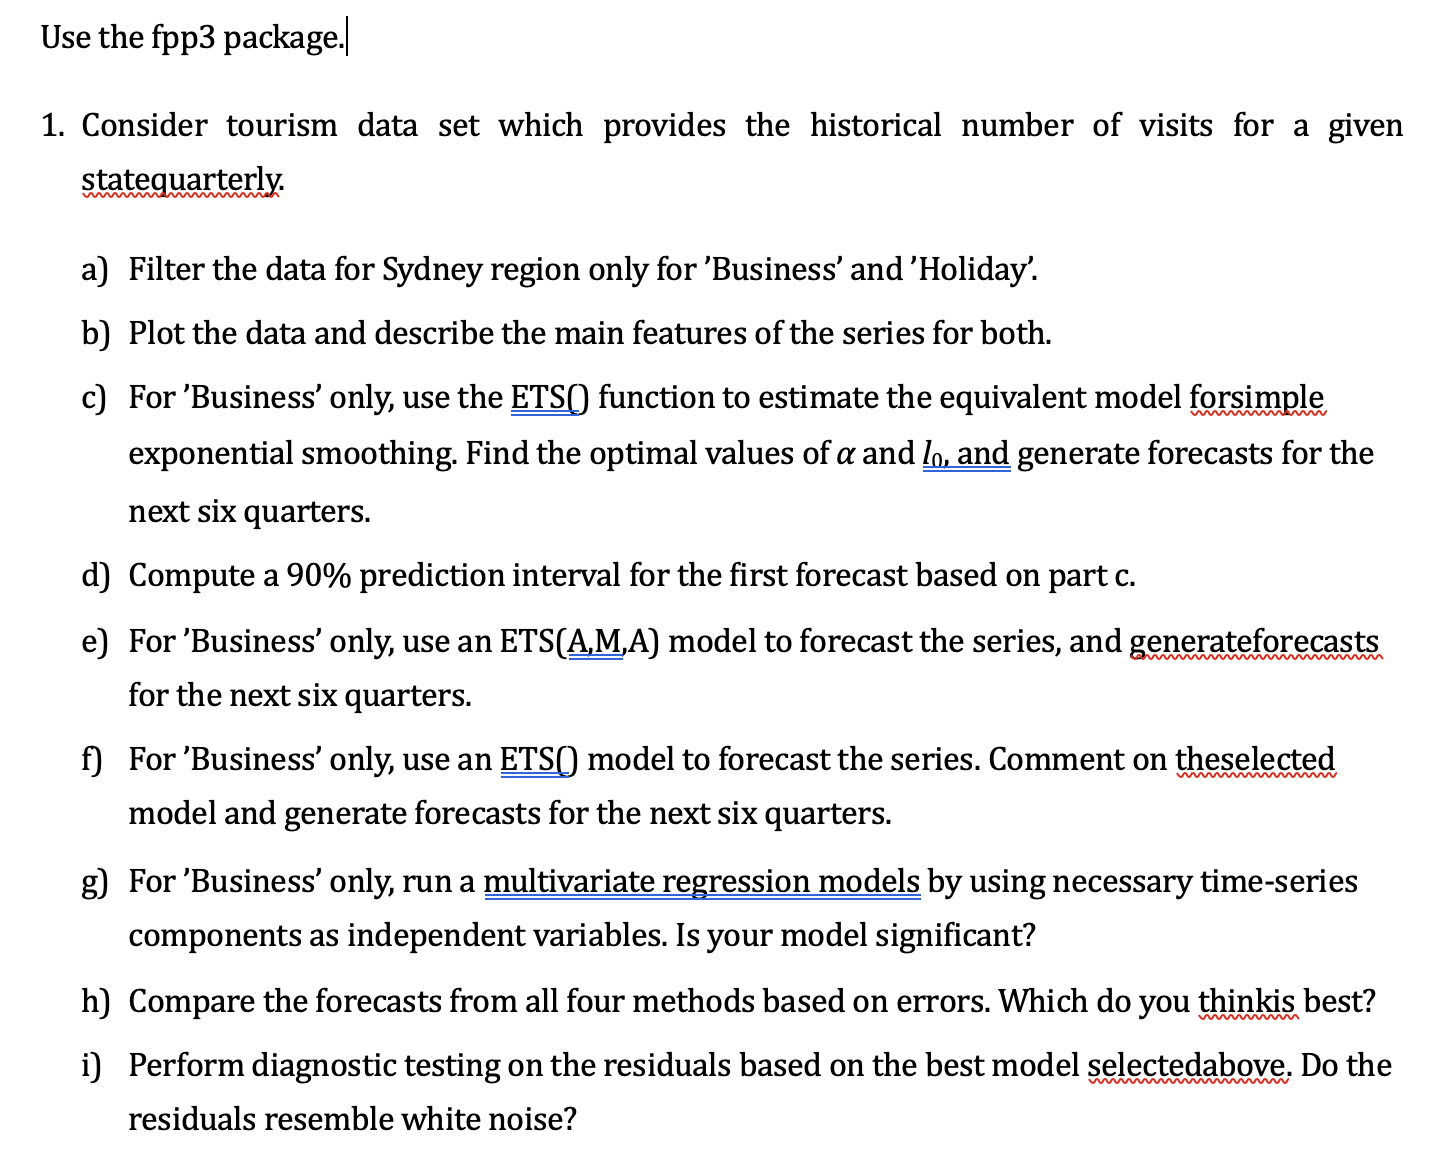
Question: Use the fpp3 package.| 1. Consider tourism data set which provides the historical number of visits for a given statequarterly. a) b) c) d e)

Use the fpp3 package.| 1. Consider tourism dataUse the fpp3 package.| 1. Consider tourism data
Use the fpp3 package.| 1. Consider tourism data set which provides the historical number of visits for a given statequarterly. a) b) c) d e) g) h i) Nt Filter the data for Sydney region only for 'Business' and "Holiday'" Plot the data and describe the main features of the series for both. For 'Business' only, use the ETS() function to estimate the equivalent model forsimple exponential smoothing. Find the optimal values of @ and [y, and generate forecasts for the next six quarters. Compute a 90% prediction interval for the first forecast based on partc. For 'Business' only, use an ETS(A,M,A) model to forecast the series, and generateforecasts for the next six quarters. For 'Business' only, use an ETS() model to forecast the series. Comment on theselected model and generate forecasts for the next six quarters. For 'Business' only, run a multivariate regression models by using necessary time-series components as independent variables. Is your model significant? Compare the forecasts from all four methods based on errors. Which do you thinkis best? Perform diagnostic testing on the residuals based on the best model selectedabove. Do the residuals resemble white noise? 2. Consider prices data set which provides information on annual prices for eggs, chicken, coppernails, oil and wheat. All prices adjusted for inflation. a) Filter the data for wheat prices starting from year 1890. Use the filtered data forthe questions below after that. b N Plot the historical data and ACF to comment on whether data is stationary. Ifnot, perform the necessary manipulations to make it stationary and show your work. c) Plot ACF on the stationary data. What can you learn from the ACF graph ofthe stationary data? d) Plot PACF on the stationary data. What can you learn from the PACF graph ofthe stationary data? e) What model would you recommend based on your observations of ACF and PACF? Fit an ARIMA model based on your recommendation. f) Perform diagnostic testing on the residuals. Do the residuals resemble whitenoise? If not, try to find another ARIMA model which fits better. g) Use ARIMA() to find an appropriate ARIMA model. What model did the automated ARIMA select? Check that the residuals look like white noise. h) Which ETS model can be a good fit for this data set? Fit your recommendedETS() model. i) Which of the three models you built above is better? Comment. j) Plot forecasts for the next 10 periods based on the best model. Comment on thepredictions

Step by Step Solution

There are 3 Steps involved in it

1 Expert Approved Answer
Step: 1 Unlock blur-text-image
Question Has Been Solved by an Expert!

Get step-by-step solutions from verified subject matter experts

Step: 2 Unlock
Step: 3 Unlock

Students Have Also Explored These Related Law Questions!