

Question: Use the G20 macro data on Oct. 20, 2020 from the Economist to answer the following questions: 1) Current spot rates. What are the current
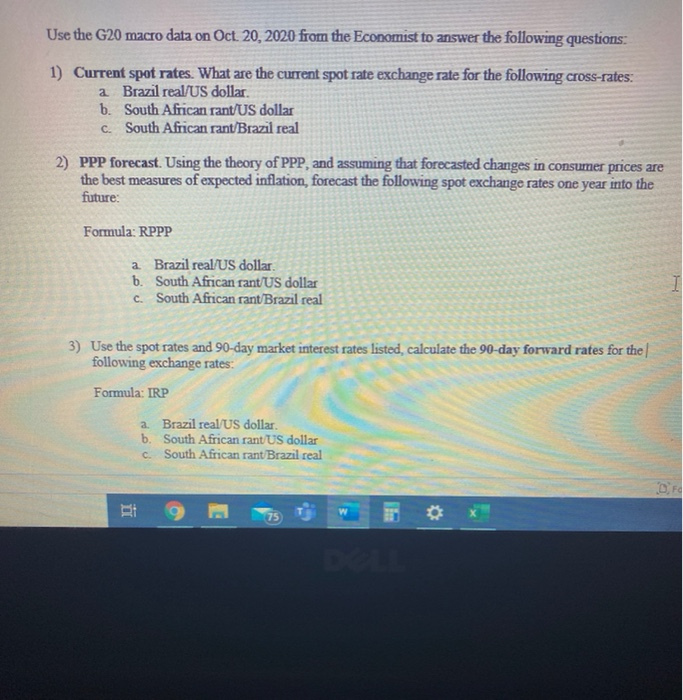
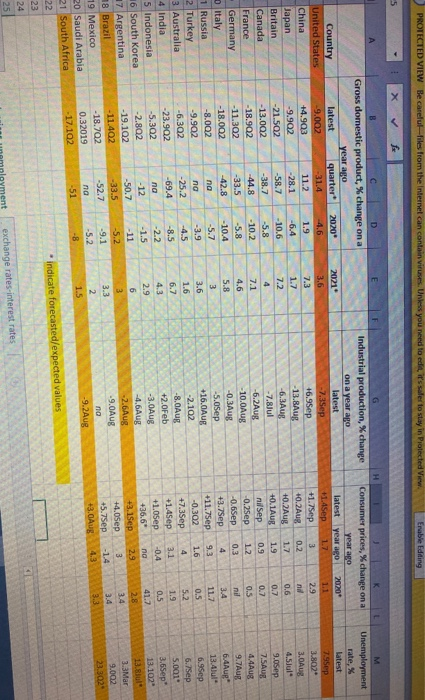
Use the G20 macro data on Oct. 20, 2020 from the Economist to answer the following questions: 1) Current spot rates. What are the current spot rate exchange rate for the following cross-rates: a Brazil real US dollar. b. South African rant/US dollar c. South African rant/Brazil real 2) PPP forecast. Using the theory of PPP, and assuming that forecasted changes in consumer prices are the best measures of expected inflation, forecast the following spot exchange rates one year into the future: Formula: RPPP a Brazil real US dollar. b. South African rant/US dollar C. South African rant/Brazil real I 3) Use the spot rates and 90-day market interest rates listed calculate the 90-day forward rates for the following exchange rates: Formula: IRP 2. Brazil real US dollar. b. South African rant US dollar c. South African rant/Brazil real 75 PROTECTED VIEW Be Careluiles from the Internet can contain viruses. Unless you need to edit, it's safe to stay in Protected View Erable Editing 5 X f A E H M Unemployment rate, Latest 7.95ep 3.802 3.0Aug 4.Slul 9.Sep 7.5AUR 4.4Aug 2021 3.6 7.3 1.7 7.2 4 11.2 7.1 4.6 5.8 9.7Aug Country United States China Japan Britain Canada France Germany Italy 1 Russia 2 Turkey 3 Australia 4 India 5 Indonesia 16 South Korea 17 Argentina 18 Brazil 19 Mexico 20 Saudi Arabia 21 South Africa 22 D Gross domestic product, % change on a year ago latest quarter 2020 9.002 -31.4 -4.6 +4.903 1.9 -9.902 -28.1 -6.4 -21.502 -58.7 - 10.6 - 13.002 -38.7 -5.8 -18.902 -44.8 - 10.2 - 11.302 -33.5 -5.8 -18.002 -42.8 -10.4 -8.002 na -5.7 -9.902 na -3.9 -6.302 -25.2 -4.5 -23.902 -69.4 -8.5 -5.302 na -2.2 -2.802 -12 -1.5 - 19.102 -50.7 -11 -11.402 -33.5 -5.2 - 18.702 -52.7 -9.1 0.32019 na -5.2 - 17.102 -51 -8 Industrial production, % change on a year ago latest -7.3Sep +6.95ep -13.8Aug -6.3Aug -7.8Jul -6.2Aug - 10.0Aug -0.3Aug -5.05ep +16.0Aug -2.102 -8.0Aug +2.0Feb -3.0Aug -4.6Aug -2.6Aug -9.0Aug na -9.2Aug Consumer prices, % change on a year ago latest year ago 2020 +1.45ep 1.7 1.1 +1.75ep 3 2.9 +0.2Aug 0.2 nd +0.2Aug 1.7 0.6 +0. LAUR 1.9 0.7 nil Sep 0.9 0.7 -0.25ep 1.2 0.5 -0.6Sep 0.3 nil +3.7Sep 4 3.4 +11.7Sep 9.3 117 -0.302 1.6 0.5 +7.3Sep 4 5.2 +1.45ep 3.1 1.9 +1.05ep -0.4 0.5 +36.6" na 41.7 +3.15ep 2.9 2.8 +4.0Sep 3 +5.75ep +3.0 Aug 3.3 3 3.6 1.6 6.7 4.3 6.4Aug" 13.41 6.9Sep 6.Sep 5.001" 3.65ep 13.102 13.Jul 3.3 Mar 9.002 23.3029 2.9 6 3 3.4 3.3 2 1.5 - indicate forecasted/expected values 23 24 25 exchange rates-interest rates Use the G20 macro data on Oct. 20, 2020 from the Economist to answer the following questions: 1) Current spot rates. What are the current spot rate exchange rate for the following cross-rates: a Brazil real US dollar. b. South African rant/US dollar c. South African rant/Brazil real 2) PPP forecast. Using the theory of PPP, and assuming that forecasted changes in consumer prices are the best measures of expected inflation, forecast the following spot exchange rates one year into the future: Formula: RPPP a Brazil real US dollar. b. South African rant/US dollar C. South African rant/Brazil real I 3) Use the spot rates and 90-day market interest rates listed calculate the 90-day forward rates for the following exchange rates: Formula: IRP 2. Brazil real US dollar. b. South African rant US dollar c. South African rant/Brazil real 75 PROTECTED VIEW Be Careluiles from the Internet can contain viruses. Unless you need to edit, it's safe to stay in Protected View Erable Editing 5 X f A E H M Unemployment rate, Latest 7.95ep 3.802 3.0Aug 4.Slul 9.Sep 7.5AUR 4.4Aug 2021 3.6 7.3 1.7 7.2 4 11.2 7.1 4.6 5.8 9.7Aug Country United States China Japan Britain Canada France Germany Italy 1 Russia 2 Turkey 3 Australia 4 India 5 Indonesia 16 South Korea 17 Argentina 18 Brazil 19 Mexico 20 Saudi Arabia 21 South Africa 22 D Gross domestic product, % change on a year ago latest quarter 2020 9.002 -31.4 -4.6 +4.903 1.9 -9.902 -28.1 -6.4 -21.502 -58.7 - 10.6 - 13.002 -38.7 -5.8 -18.902 -44.8 - 10.2 - 11.302 -33.5 -5.8 -18.002 -42.8 -10.4 -8.002 na -5.7 -9.902 na -3.9 -6.302 -25.2 -4.5 -23.902 -69.4 -8.5 -5.302 na -2.2 -2.802 -12 -1.5 - 19.102 -50.7 -11 -11.402 -33.5 -5.2 - 18.702 -52.7 -9.1 0.32019 na -5.2 - 17.102 -51 -8 Industrial production, % change on a year ago latest -7.3Sep +6.95ep -13.8Aug -6.3Aug -7.8Jul -6.2Aug - 10.0Aug -0.3Aug -5.05ep +16.0Aug -2.102 -8.0Aug +2.0Feb -3.0Aug -4.6Aug -2.6Aug -9.0Aug na -9.2Aug Consumer prices, % change on a year ago latest year ago 2020 +1.45ep 1.7 1.1 +1.75ep 3 2.9 +0.2Aug 0.2 nd +0.2Aug 1.7 0.6 +0. LAUR 1.9 0.7 nil Sep 0.9 0.7 -0.25ep 1.2 0.5 -0.6Sep 0.3 nil +3.7Sep 4 3.4 +11.7Sep 9.3 117 -0.302 1.6 0.5 +7.3Sep 4 5.2 +1.45ep 3.1 1.9 +1.05ep -0.4 0.5 +36.6" na 41.7 +3.15ep 2.9 2.8 +4.0Sep 3 +5.75ep +3.0 Aug 3.3 3 3.6 1.6 6.7 4.3 6.4Aug" 13.41 6.9Sep 6.Sep 5.001" 3.65ep 13.102 13.Jul 3.3 Mar 9.002 23.3029 2.9 6 3 3.4 3.3 2 1.5 - indicate forecasted/expected values 23 24 25 exchange rates-interest rates
Step by Step Solution
There are 3 Steps involved in it

Get step-by-step solutions from verified subject matter experts