

Question: please show work i would like to know how to do this, thank you! :) Use the attached G20 macro data on Oct 25, 2021
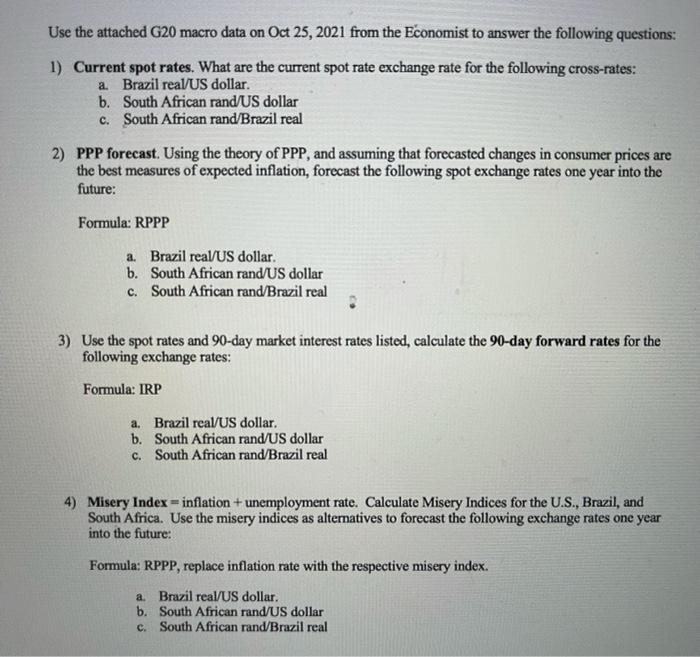
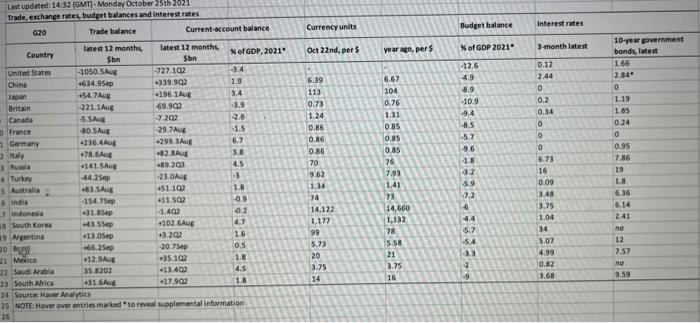
Use the attached G20 macro data on Oct 25, 2021 from the Economist to answer the following questions: 1) Current spot rates. What are the current spot rate exchange rate for the following cross-rates: a. Brazil real US dollar. b. South African rand/US dollar c. South African rand/Brazil real 2) PPP forecast. Using the theory of PPP, and assuming that forecasted changes in consumer prices are the best measures of expected inflation, forecast the following spot exchange rates one year into the future: Formula: RPPP a. Brazil real/US dollar. b. South African rand/US dollar c. South African rand/Brazil real 3) Use the spot rates and 90-day market interest rates listed, calculate the 90-day forward rates for the following exchange rates: Formula: IRP a. Brazil real/US dollar, b. South African rand/US dollar c. South African rand/Brazil real 4) Misery Index = inflation + unemployment rate. Calculate Misery Indices for the U.S., Brazil, and South Africa. Use the misery indices as alternatives to forecast the following exchange rates one year into the future: Formula: RPPP, replace inflation rate with the respective misery index. a Brazil real/US dollar. b. South African rand/US dollar c. South African rand/Brazil real Last updated: 14:32 (GMT - Monday October 25th 2021 Trade, exchange rates, budget balances and interest rates G20 Trade balance Current account balance Currency units Budget balance Interest rates Oct 22nd, pers 3 month latest % of GDP 2021 year ago, per Intest 12 months latest 12 months, Country Nof GDP, 2021 $ha Son United States -1050 SAU -727.102 3.4 China +634.95ep +339.902 1.9 Japan 54.7 Aug 196.1 3.4 Britain 221.1 Aug 69.902 -2.9 Canada S.SAUR -7.202 France 30.5 Aug -29.7 -1.5 1 Germany +236.4 4299 3A 6.7 78.GAME -62. RAUB 3.8 Huwa *141.5A 489.200 Turkey 44 25ep -230ALE -3 3 Australia 46.SAE 151 103 10 6 India -154.75ep 11 502 -0.9 - Indonesia -31.85ep -1.400 0.2 1 South Korea 43.5Sep +3026 4.7 15 Nina 13.Sep *3.202 1.6 20 B .66.25ep 207 Sep 0.5 21 Mexico -12 SA -35.102 2 Saudi Arabia 35.8202 11.40 45 23 South Africa 31.6 -17 902 18 24 Source Haw Analytics 25 NOTE Hover over entries marked to reveal supplemental information -26 6.39 113 0.73 1.24 0.86 0.86 0.86 70 9.62 1.14 74 14,122 1,177 99 5.73 20 3.75 14 6.67 104 0.76 1.31 0.85 0.85 0.85 76 1.93 1.41 75 14,600 1,132 78 5.58 21 3.75 16 -12.6 4.9 8.9 -10.9 -94 -8.5 5.7 -9.6 -18 32 5.9 -7.2 6 4.4 5.7 -5.4 33 10-year government bonds, latest 1.66 2.84 o 1.19 1.65 0.24 0 0.95 7.86 19 18 5.36 6.14 0.12 2.44 O 0.2 0.34 0 0 0 6.73 16 0.09 3.48 3.75 1.04 34 5.02 4.99 0.82 3.68 res - Fil . 2.41 - no 12 7.57 na 9.59 2 Use the attached G20 macro data on Oct 25, 2021 from the Economist to answer the following questions: 1) Current spot rates. What are the current spot rate exchange rate for the following cross-rates: a. Brazil real US dollar. b. South African rand/US dollar c. South African rand/Brazil real 2) PPP forecast. Using the theory of PPP, and assuming that forecasted changes in consumer prices are the best measures of expected inflation, forecast the following spot exchange rates one year into the future: Formula: RPPP a. Brazil real/US dollar. b. South African rand/US dollar c. South African rand/Brazil real 3) Use the spot rates and 90-day market interest rates listed, calculate the 90-day forward rates for the following exchange rates: Formula: IRP a. Brazil real/US dollar, b. South African rand/US dollar c. South African rand/Brazil real 4) Misery Index = inflation + unemployment rate. Calculate Misery Indices for the U.S., Brazil, and South Africa. Use the misery indices as alternatives to forecast the following exchange rates one year into the future: Formula: RPPP, replace inflation rate with the respective misery index. a Brazil real/US dollar. b. South African rand/US dollar c. South African rand/Brazil real Last updated: 14:32 (GMT - Monday October 25th 2021 Trade, exchange rates, budget balances and interest rates G20 Trade balance Current account balance Currency units Budget balance Interest rates Oct 22nd, pers 3 month latest % of GDP 2021 year ago, per Intest 12 months latest 12 months, Country Nof GDP, 2021 $ha Son United States -1050 SAU -727.102 3.4 China +634.95ep +339.902 1.9 Japan 54.7 Aug 196.1 3.4 Britain 221.1 Aug 69.902 -2.9 Canada S.SAUR -7.202 France 30.5 Aug -29.7 -1.5 1 Germany +236.4 4299 3A 6.7 78.GAME -62. RAUB 3.8 Huwa *141.5A 489.200 Turkey 44 25ep -230ALE -3 3 Australia 46.SAE 151 103 10 6 India -154.75ep 11 502 -0.9 - Indonesia -31.85ep -1.400 0.2 1 South Korea 43.5Sep +3026 4.7 15 Nina 13.Sep *3.202 1.6 20 B .66.25ep 207 Sep 0.5 21 Mexico -12 SA -35.102 2 Saudi Arabia 35.8202 11.40 45 23 South Africa 31.6 -17 902 18 24 Source Haw Analytics 25 NOTE Hover over entries marked to reveal supplemental information -26 6.39 113 0.73 1.24 0.86 0.86 0.86 70 9.62 1.14 74 14,122 1,177 99 5.73 20 3.75 14 6.67 104 0.76 1.31 0.85 0.85 0.85 76 1.93 1.41 75 14,600 1,132 78 5.58 21 3.75 16 -12.6 4.9 8.9 -10.9 -94 -8.5 5.7 -9.6 -18 32 5.9 -7.2 6 4.4 5.7 -5.4 33 10-year government bonds, latest 1.66 2.84 o 1.19 1.65 0.24 0 0.95 7.86 19 18 5.36 6.14 0.12 2.44 O 0.2 0.34 0 0 0 6.73 16 0.09 3.48 3.75 1.04 34 5.02 4.99 0.82 3.68 res - Fil . 2.41 - no 12 7.57 na 9.59 2
Step by Step Solution
There are 3 Steps involved in it

Get step-by-step solutions from verified subject matter experts