

Question: Use the given data: a ) Plot of water content ( y - axis, log scale ) and penetration distance ( log scale, x axis
Use the given data:
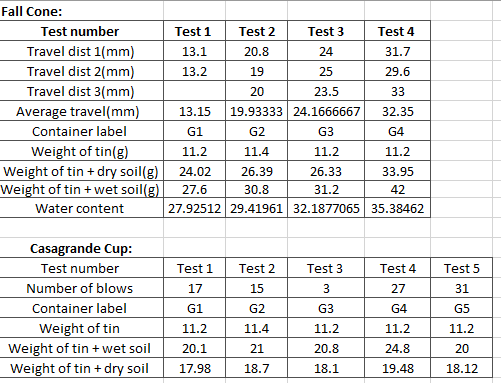
a Plot of water content yaxis, log scale and penetration distance log scale, x axis for
determining the liquid limit from the Fall Cone, with your best fit trendline and R value.
bPlot of water content yaxis, normal scale and number of blows log scale, x axis for determining the liquid limit from the Casagrande Cup, with your best fit trendline and R value.
c Plot LL and PI on the Casagrande plasticity chart below for BOTH tests. Include a legend to distinguish the results from each method.
Step by Step Solution
There are 3 Steps involved in it
1 Expert Approved Answer
Step: 1 Unlock

Question Has Been Solved by an Expert!
Get step-by-step solutions from verified subject matter experts
Step: 2 Unlock
Step: 3 Unlock